Data for Exercise 10.26
RegionFormat
A data frame/tibble with 48 observations on three variables
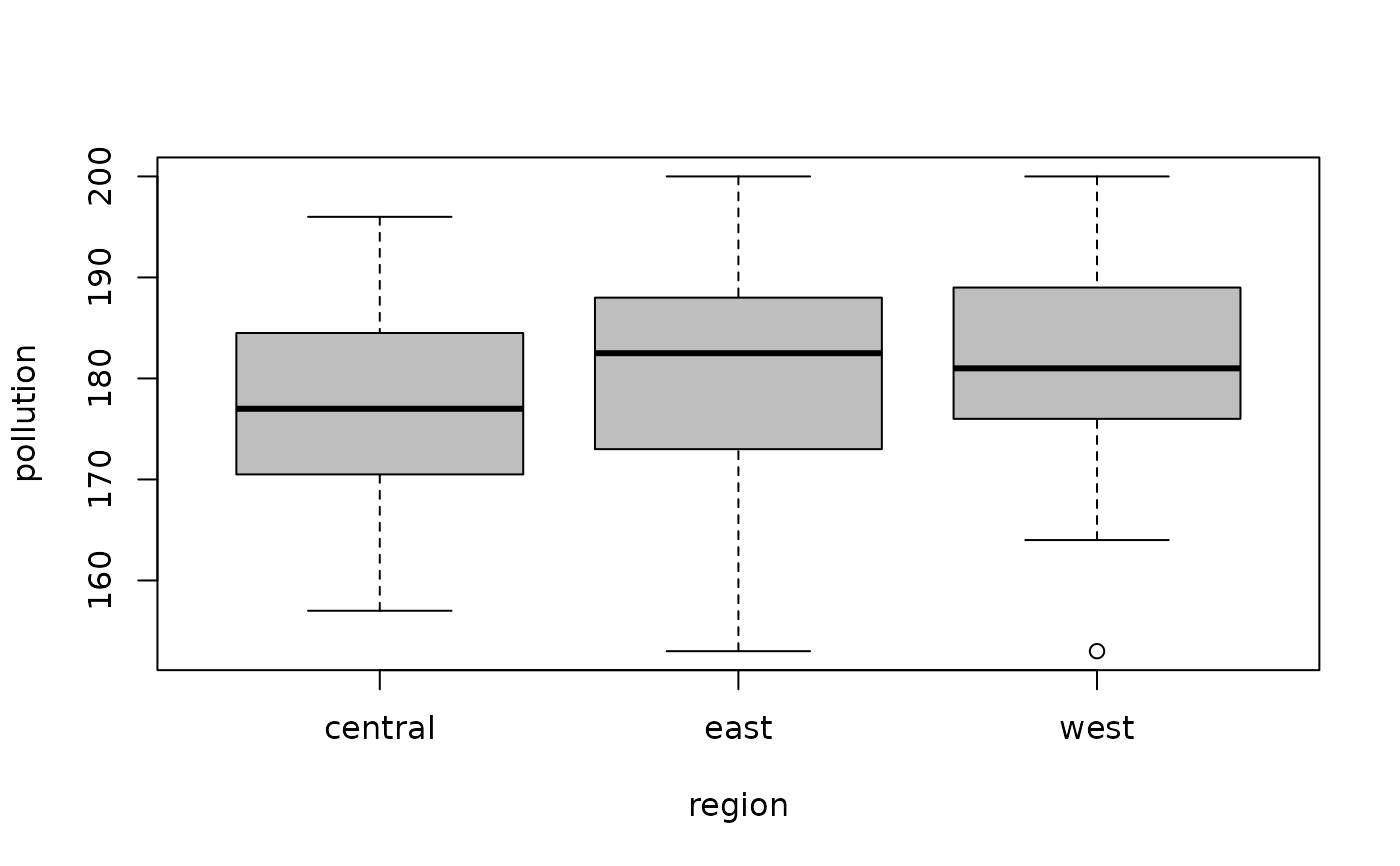
- pollution
pollution index
- region
region of a county (
west,central, andeast)- ranks
ranked values of
pollution
References
Kitchens, L. J. (2003) Basic Statistics and Data Analysis. Pacific Grove, CA: Brooks/Cole, a division of Thomson Learning.