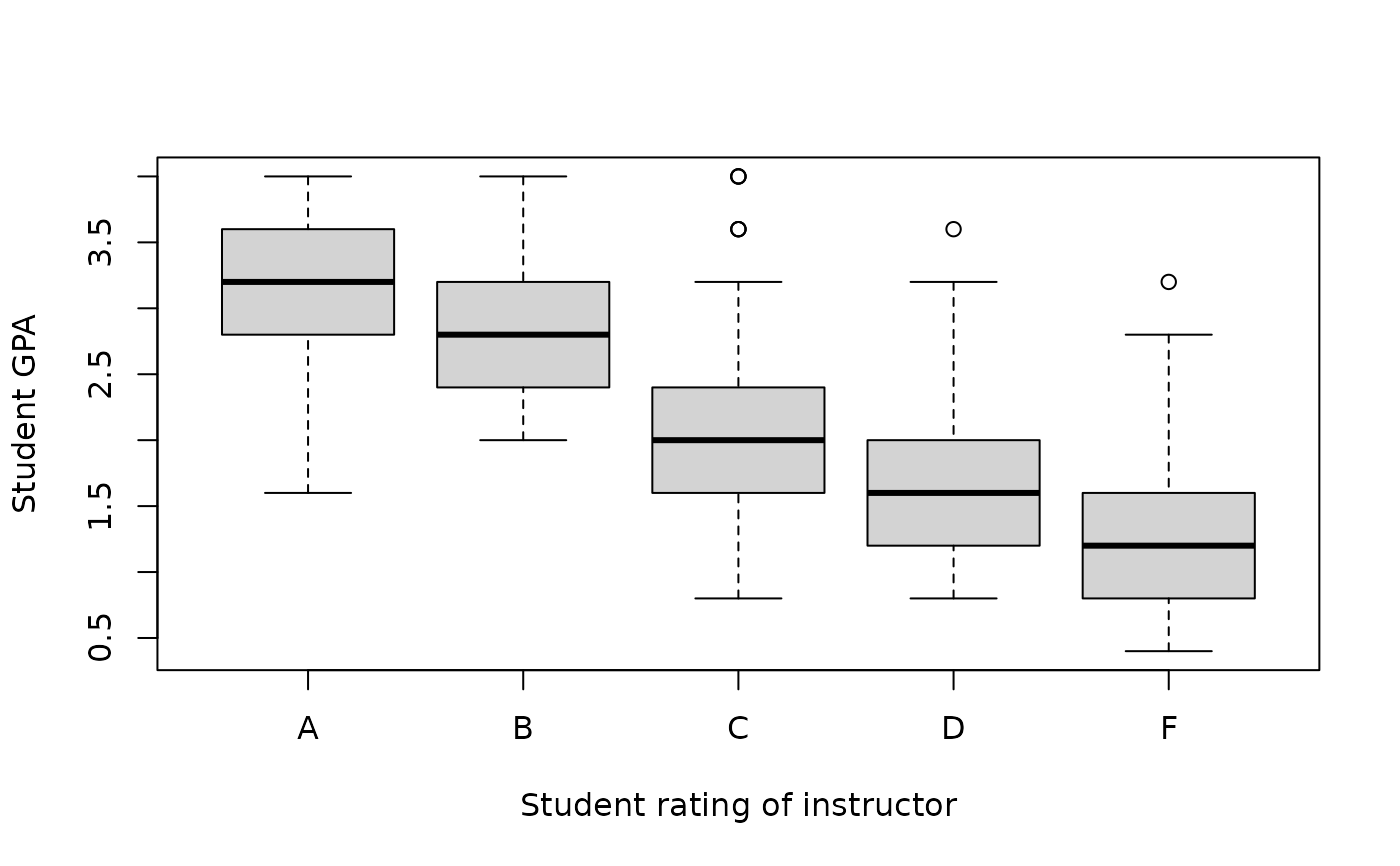
Data for Example 2.6
RatingsFormat
A data frame/tibble with 250 observations on two variables
- rating
character variable with students' ratings of instructor (A-F)
- gpa
students' grade point average
References
Kitchens, L. J. (2003) Basic Statistics and Data Analysis. Pacific Grove, CA: Brooks/Cole, a division of Thomson Learning.
Examples
boxplot(gpa ~ rating, data = Ratings, xlab = "Student rating of instructor",
        ylab = "Student GPA")

if (FALSE) {
library(ggplot2)
ggplot2::ggplot(data = Ratings, aes(x = rating, y = gpa, fill = rating)) +
           geom_boxplot() +
           theme_bw() +
           theme(legend.position = "none") +
           labs(x = "Student rating of instructor", y = "Student GPA")
}