Data for Exercise 1.52, 1.76, 5.62, and 6.44
RatFormat
A data frame/tibble with 20 observations on one variable
- survival_time
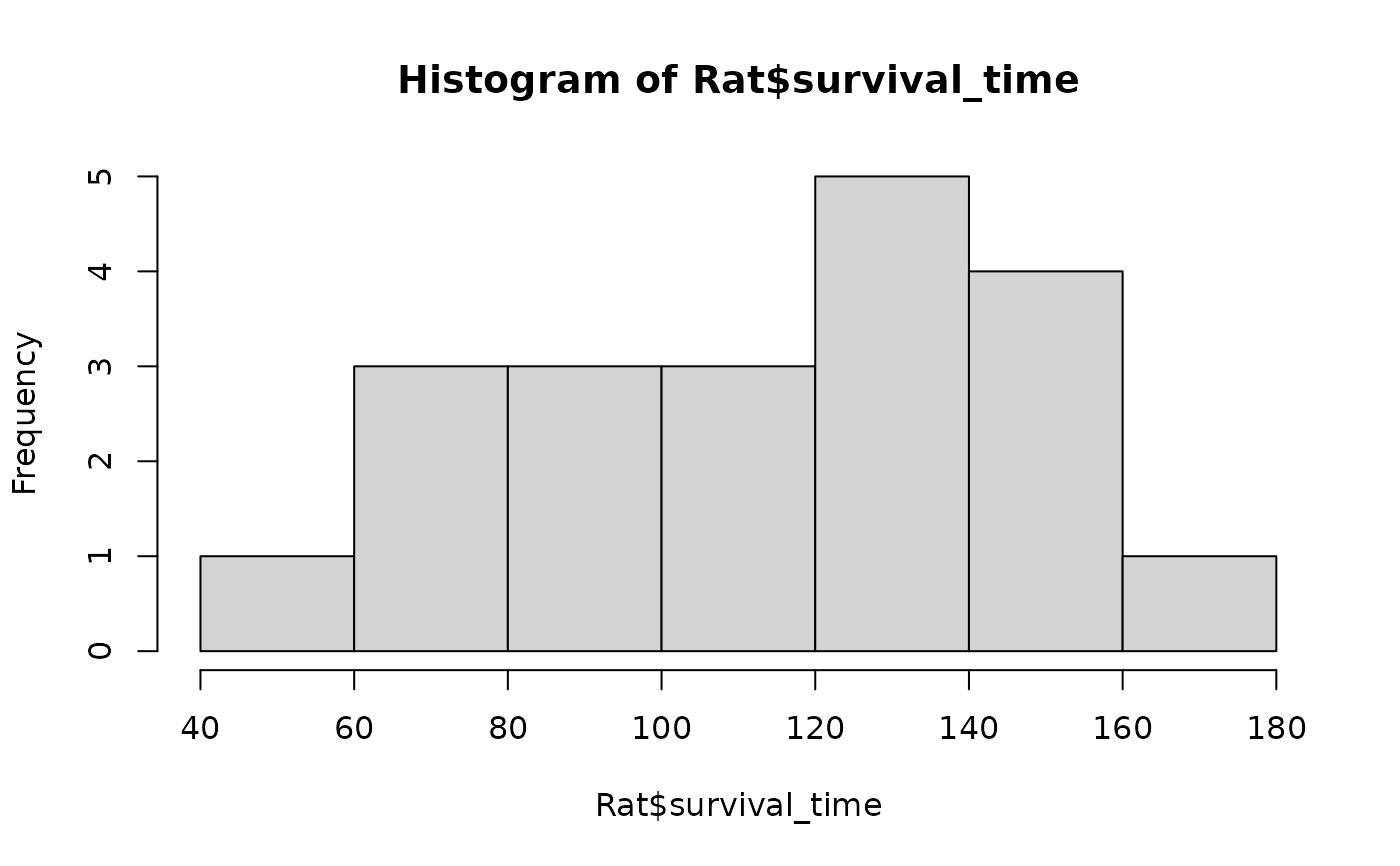
survival time in weeks for rats exposed to a high level of radiation
Source
J. Lawless, Statistical Models and Methods for Lifetime Data (New York: Wiley, 1982).
References
Kitchens, L. J. (2003) Basic Statistics and Data Analysis. Pacific Grove, CA: Brooks/Cole, a division of Thomson Learning.
Examples
hist(Rat$survival_time)
 qqnorm(Rat$survival_time)
qqline(Rat$survival_time)
qqnorm(Rat$survival_time)
qqline(Rat$survival_time)
 summary(Rat$survival_time)
#> Min. 1st Qu. Median Mean 3rd Qu. Max.
#> 40.00 86.75 119.00 113.45 140.75 165.00
t.test(Rat$survival_time)
#>
#> One Sample t-test
#>
#> data: Rat$survival_time
#> t = 14.176, df = 19, p-value = 1.48e-11
#> alternative hypothesis: true mean is not equal to 0
#> 95 percent confidence interval:
#> 96.69997 130.20003
#> sample estimates:
#> mean of x
#> 113.45
#>
t.test(Rat$survival_time, mu = 100, alternative = "greater")
#>
#> One Sample t-test
#>
#> data: Rat$survival_time
#> t = 1.6807, df = 19, p-value = 0.0546
#> alternative hypothesis: true mean is greater than 100
#> 95 percent confidence interval:
#> 99.61212 Inf
#> sample estimates:
#> mean of x
#> 113.45
#>
summary(Rat$survival_time)
#> Min. 1st Qu. Median Mean 3rd Qu. Max.
#> 40.00 86.75 119.00 113.45 140.75 165.00
t.test(Rat$survival_time)
#>
#> One Sample t-test
#>
#> data: Rat$survival_time
#> t = 14.176, df = 19, p-value = 1.48e-11
#> alternative hypothesis: true mean is not equal to 0
#> 95 percent confidence interval:
#> 96.69997 130.20003
#> sample estimates:
#> mean of x
#> 113.45
#>
t.test(Rat$survival_time, mu = 100, alternative = "greater")
#>
#> One Sample t-test
#>
#> data: Rat$survival_time
#> t = 1.6807, df = 19, p-value = 0.0546
#> alternative hypothesis: true mean is greater than 100
#> 95 percent confidence interval:
#> 99.61212 Inf
#> sample estimates:
#> mean of x
#> 113.45
#>