Data for Exercise 7.81
QualityFormat
A data frame/tibble with 15 observations on two variables
- process
a character variable with values
Process1andProcess2- score
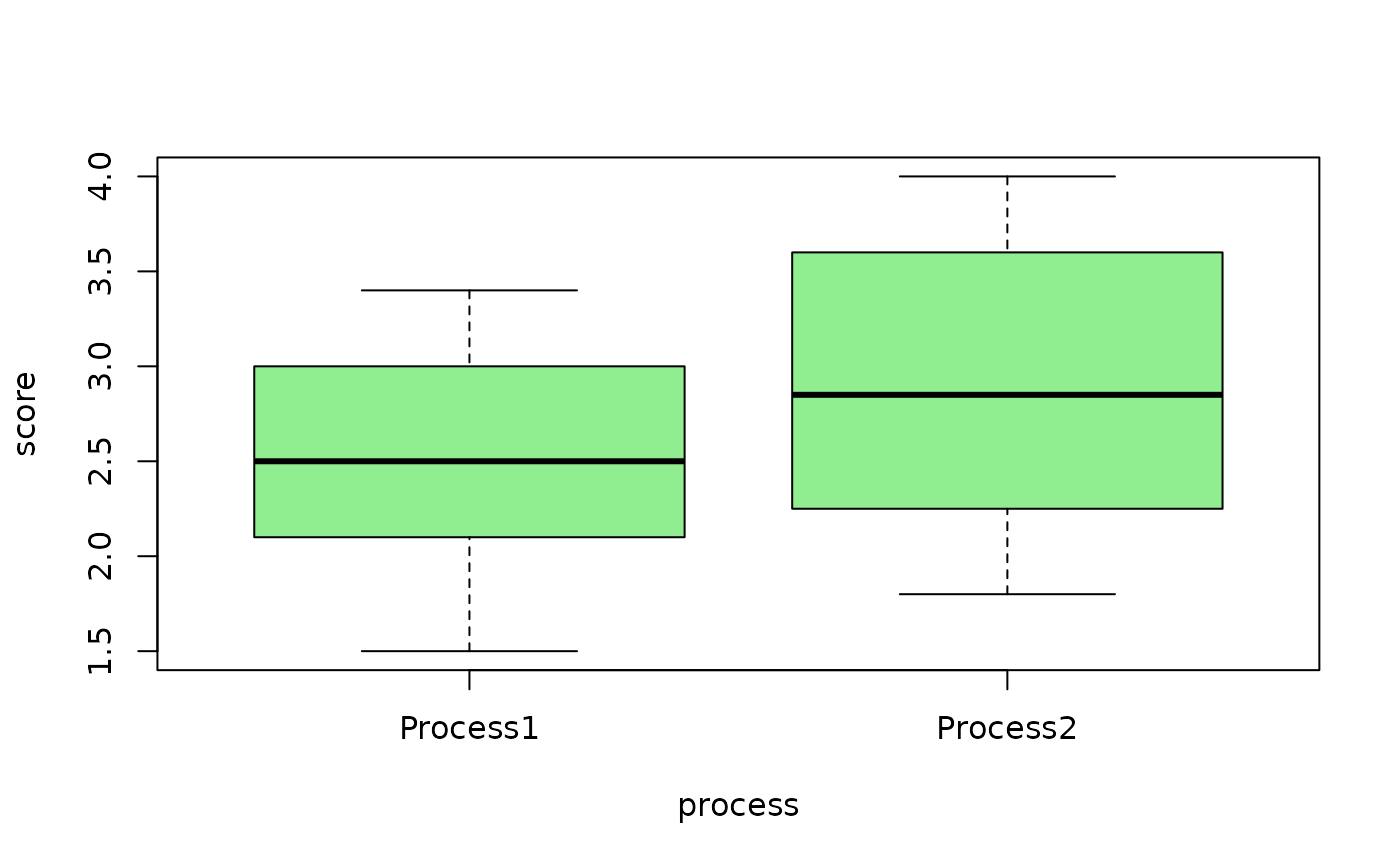
results of a quality control test
References
Kitchens, L. J. (2003) Basic Statistics and Data Analysis. Pacific Grove, CA: Brooks/Cole, a division of Thomson Learning.
Examples
boxplot(score ~ process, data = Quality, col = "lightgreen")

t.test(score ~ process, data = Quality)
#>
#> 	Welch Two Sample t-test
#>
#> data:  score by process
#> t = -1.0106, df = 12.998, p-value = 0.3307
#> alternative hypothesis: true difference in means between group Process1 and group Process2 is not equal to 0
#> 95 percent confidence interval:
#>  -1.2102969  0.4388683
#> sample estimates:
#> mean in group Process1 mean in group Process2
#>               2.514286               2.900000
#>
t.test(score ~ process, data = Quality)
#>
#> Welch Two Sample t-test
#>
#> data: score by process
#> t = -1.0106, df = 12.998, p-value = 0.3307
#> alternative hypothesis: true difference in means between group Process1 and group Process2 is not equal to 0
#> 95 percent confidence interval:
#> -1.2102969 0.4388683
#> sample estimates:
#> mean in group Process1 mean in group Process2
#> 2.514286 2.900000
#>