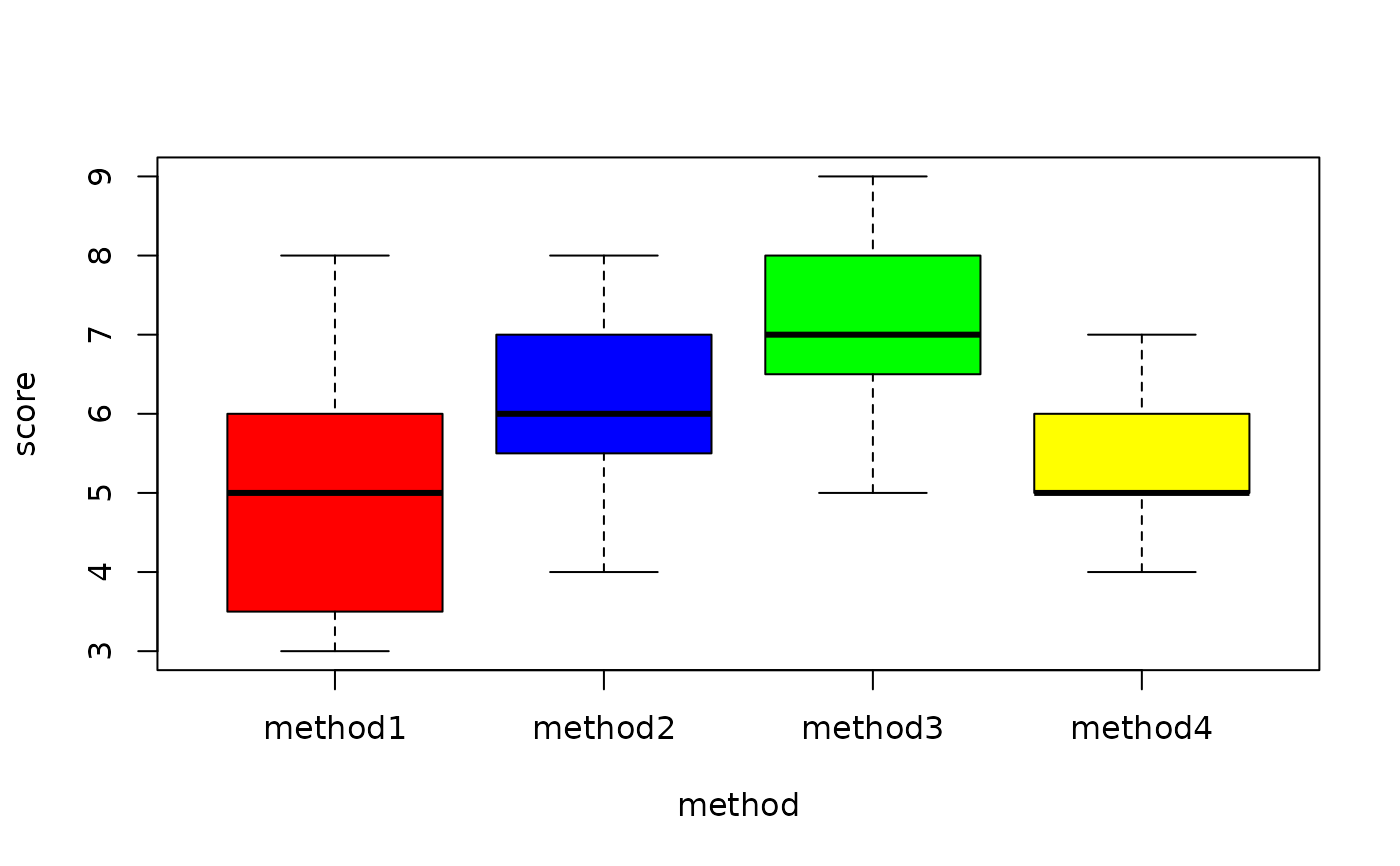
Effects of four different methods of programmed learning for statistics students
Source:R/BSDA-package.R
Program.RdData for Exercise 10.17
ProgramFormat
A data frame/tibble with 44 observations on two variables
- method
a character variable with values
method1,method2,method3, andmethod4- score
standardized test score
References
Kitchens, L. J. (2003) Basic Statistics and Data Analysis. Pacific Grove, CA: Brooks/Cole, a division of Thomson Learning.
Examples
boxplot(score ~ method, col = c("red", "blue", "green", "yellow"), data = Program)

anova(lm(score ~ method, data = Program))
#> Analysis of Variance Table
#>
#> Response: score
#>           Df Sum Sq Mean Sq F value    Pr(>F)
#> method     3 32.455 10.8182  7.1257 0.0006043 ***
#> Residuals 40 60.727  1.5182
#> ---
#> Signif. codes:  0 ‘***’ 0.001 ‘**’ 0.01 ‘*’ 0.05 ‘.’ 0.1 ‘ ’ 1
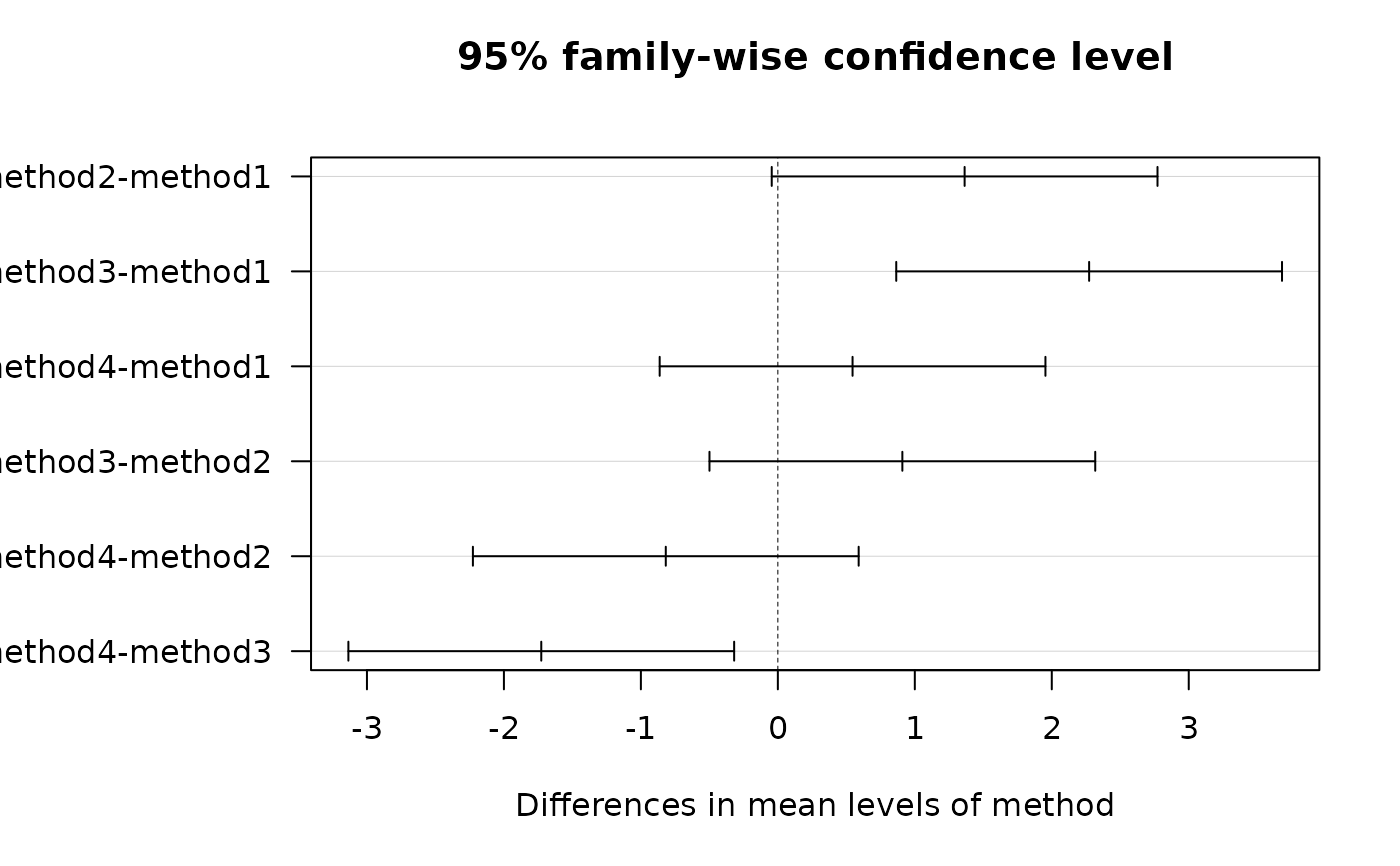
TukeyHSD(aov(score ~ method, data = Program))
#>   Tukey multiple comparisons of means
#>     95% family-wise confidence level
#>
#> Fit: aov(formula = score ~ method, data = Program)
#>
#> $method
#>                       diff         lwr        upr     p adj
#> method2-method1  1.3636364 -0.04462508  2.7718978 0.0607727
#> method3-method1  2.2727273  0.86446583  3.6809887 0.0005511
#> method4-method1  0.5454545 -0.86280690  1.9537160 0.7282383
#> method3-method2  0.9090909 -0.49917054  2.3173524 0.3218465
#> method4-method2 -0.8181818 -2.22644326  0.5900796 0.4140367
#> method4-method3 -1.7272727 -3.13553417 -0.3190113 0.0109054
#>
par(mar = c(5.1, 4.1 + 4, 4.1, 2.1))
plot(TukeyHSD(aov(score ~ method, data = Program)), las = 1)

par(mar = c(5.1, 4.1, 4.1, 2.1))