Data for Exercise 1.126
PresidenFormat
A data frame/tibble with 43 observations on five variables
- first_initial
a factor with levels
A.,B.,C.,D.,F.,G.,G. W.,H.,J.,L.,M.,R.,T.,U.,W., andZ.- last_name
a factor with levels
Adams,Arthur,Buchanan,Bush,Carter,Cleveland,Clinton,Coolidge,Eisenhower,Fillmore,Ford,Garfield,Grant,Harding,Harrison,Hayes,Hoover,Jackson,Jefferson,Johnson,Kennedy,Lincoln,Madison,McKinley,Monroe,Nixon,Pierce,Polk,Reagan,Roosevelt,Taft,Taylor,Truman,Tyler,VanBuren,Washington, andWilson- birth_state
a factor with levels
ARK,CAL,CONN,GA,IA,ILL,KY,MASS,MO,NC,NEB,NH,NJ,NY,OH,PA,SC,TEX,VA, andVT- inaugural_age
President's age at inauguration
- death_age
President's age at death
References
Kitchens, L. J. (2003) Basic Statistics and Data Analysis. Pacific Grove, CA: Brooks/Cole, a division of Thomson Learning.
Examples
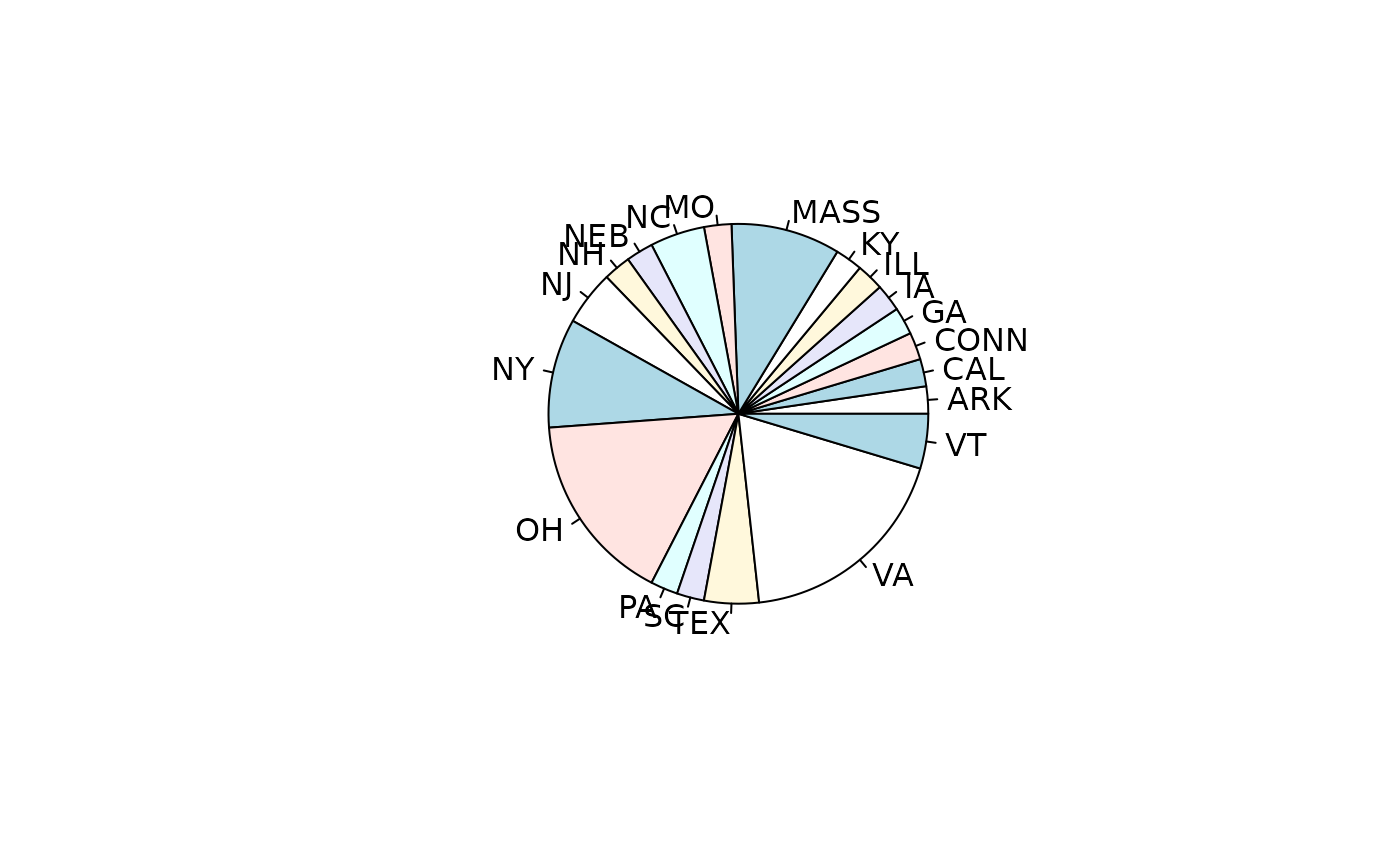
pie(xtabs(~birth_state, data = Presiden))
 stem(Presiden$inaugural_age)
#>
#> The decimal point is 1 digit(s) to the right of the |
#>
#> 4 | 23
#> 4 | 667899
#> 5 | 0011112244444
#> 5 | 555566677778
#> 6 | 0111244
#> 6 | 589
#>
stem(Presiden$death_age)
#>
#> The decimal point is 1 digit(s) to the right of the |
#>
#> 4 | 69
#> 5 | 3
#> 5 | 6778
#> 6 | 003344
#> 6 | 567778
#> 7 | 0111234
#> 7 | 7889
#> 8 | 013
#> 8 | 58
#> 9 | 00
#>
par(mar = c(5.1, 4.1 + 3, 4.1, 2.1))
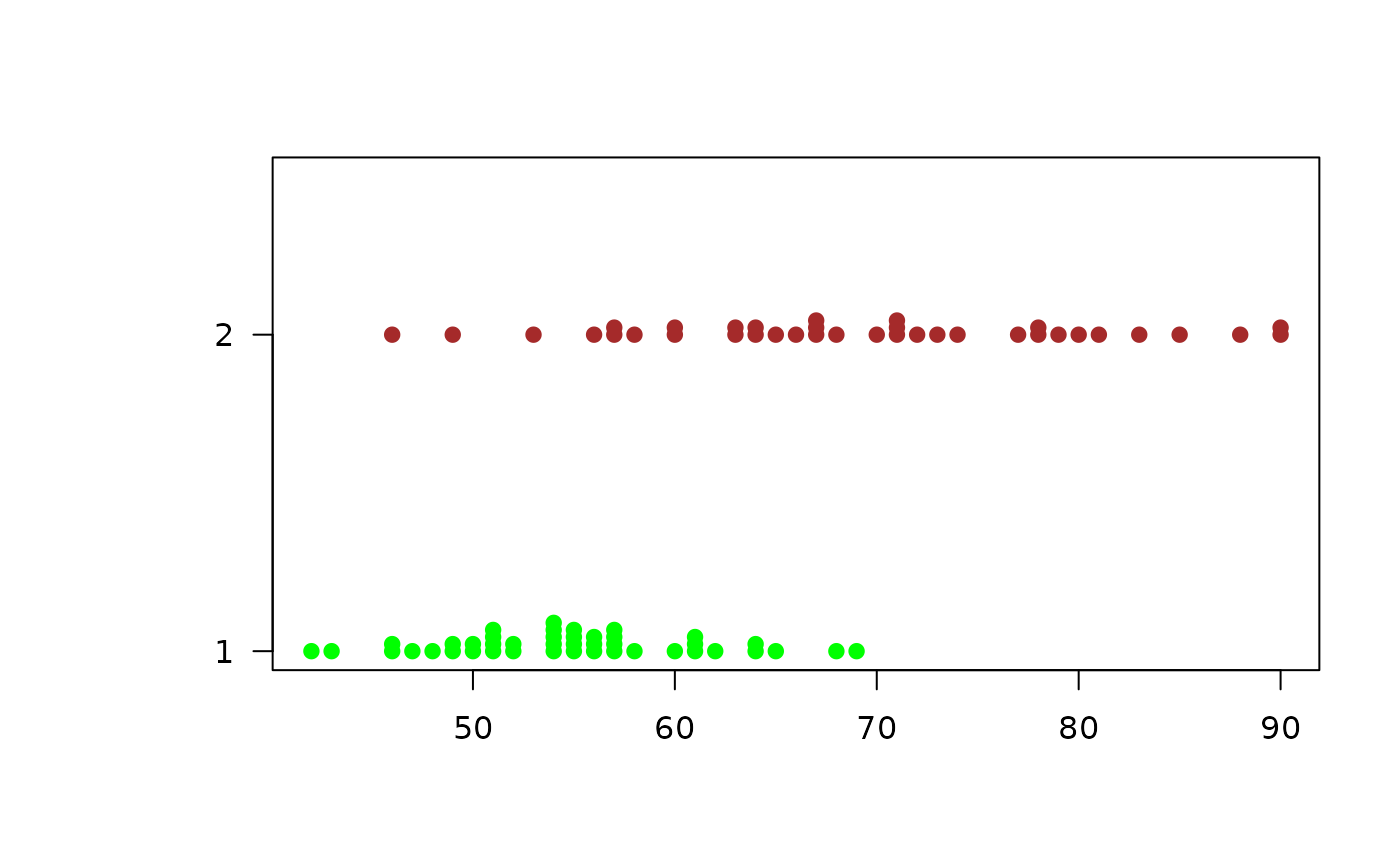
stripchart(x=list(Presiden$inaugural_age, Presiden$death_age),
method = "stack", col = c("green","brown"), pch = 19, las = 1)
stem(Presiden$inaugural_age)
#>
#> The decimal point is 1 digit(s) to the right of the |
#>
#> 4 | 23
#> 4 | 667899
#> 5 | 0011112244444
#> 5 | 555566677778
#> 6 | 0111244
#> 6 | 589
#>
stem(Presiden$death_age)
#>
#> The decimal point is 1 digit(s) to the right of the |
#>
#> 4 | 69
#> 5 | 3
#> 5 | 6778
#> 6 | 003344
#> 6 | 567778
#> 7 | 0111234
#> 7 | 7889
#> 8 | 013
#> 8 | 58
#> 9 | 00
#>
par(mar = c(5.1, 4.1 + 3, 4.1, 2.1))
stripchart(x=list(Presiden$inaugural_age, Presiden$death_age),
method = "stack", col = c("green","brown"), pch = 19, las = 1)
 par(mar = c(5.1, 4.1, 4.1, 2.1))