Data for Exercise 1.113
PoisonFormat
A data frame/tibble with 226,361 observations on one variable
- type
a factor with levels
Alcohol,Cleaning agent,Cosmetics,Drugs,Insecticides, andPlants
Source
Centers for Disease Control, Atlanta, Georgia.
References
Kitchens, L. J. (2003) Basic Statistics and Data Analysis. Pacific Grove, CA: Brooks/Cole, a division of Thomson Learning.
Examples
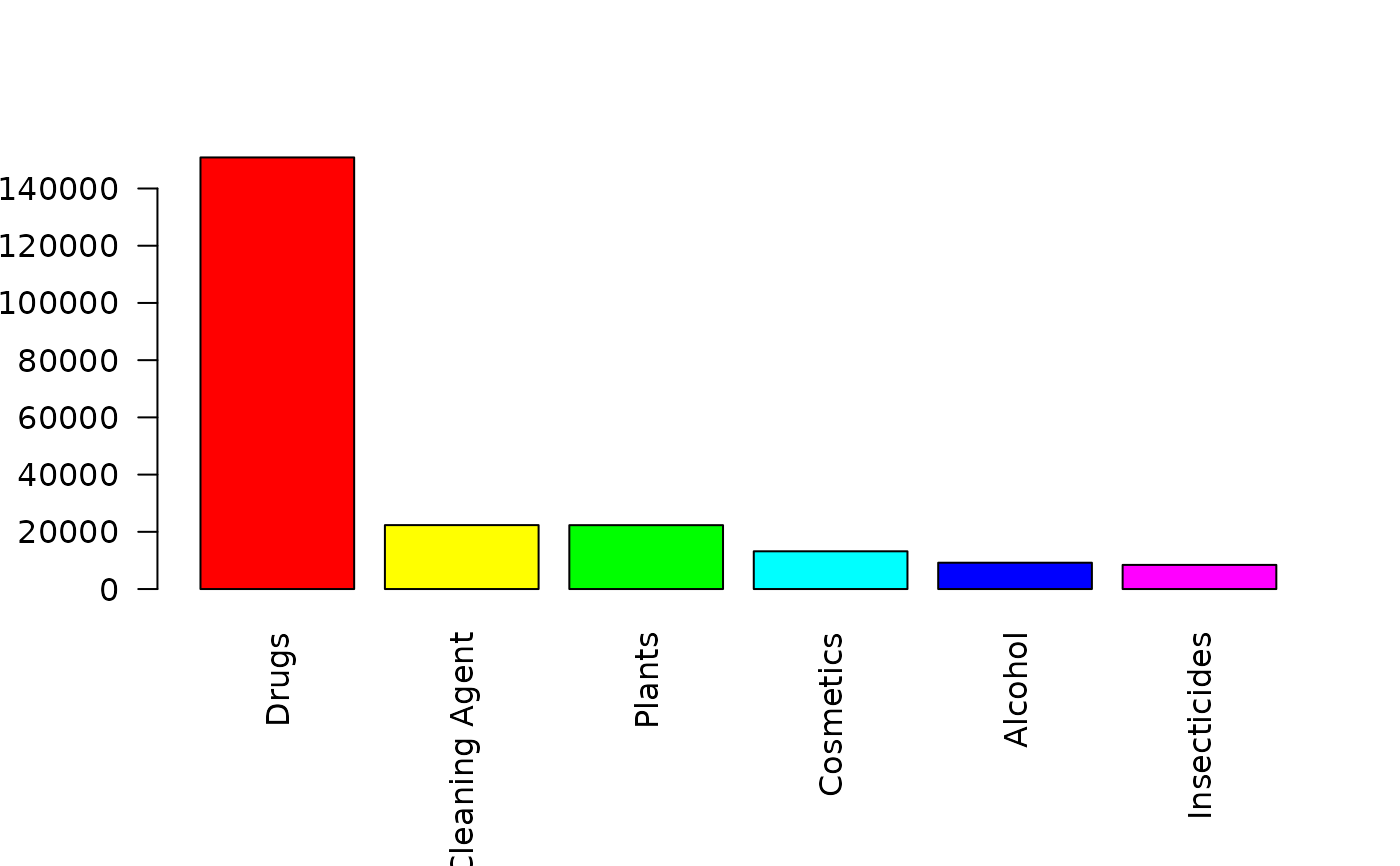
T1 <- xtabs(~type, data = Poison)
T1
#> type
#>        Alcohol Cleaning Agent      Cosmetics          Drugs   Insecticides
#>           9201          22347          13192         150857           8438
#>         Plants
#>          22326
par(mar = c(5.1 + 2, 4.1, 4.1, 2.1))
barplot(sort(T1, decreasing = TRUE), las = 2, col = rainbow(6))

par(mar = c(5.1, 4.1, 4.1, 2.1))
rm(T1)
if (FALSE) {
library(ggplot2)
ggplot2::ggplot(data = Poison, aes(x = type, fill = type)) +
           geom_bar() +
           theme_bw() +
           theme(axis.text.x  = element_text(angle = 85, vjust = 0.5)) +
           guides(fill = FALSE)
}
par(mar = c(5.1, 4.1, 4.1, 2.1))
rm(T1)
if (FALSE) {
library(ggplot2)
ggplot2::ggplot(data = Poison, aes(x = type, fill = type)) +
geom_bar() +
theme_bw() +
theme(axis.text.x = element_text(angle = 85, vjust = 0.5)) +
guides(fill = FALSE)
}