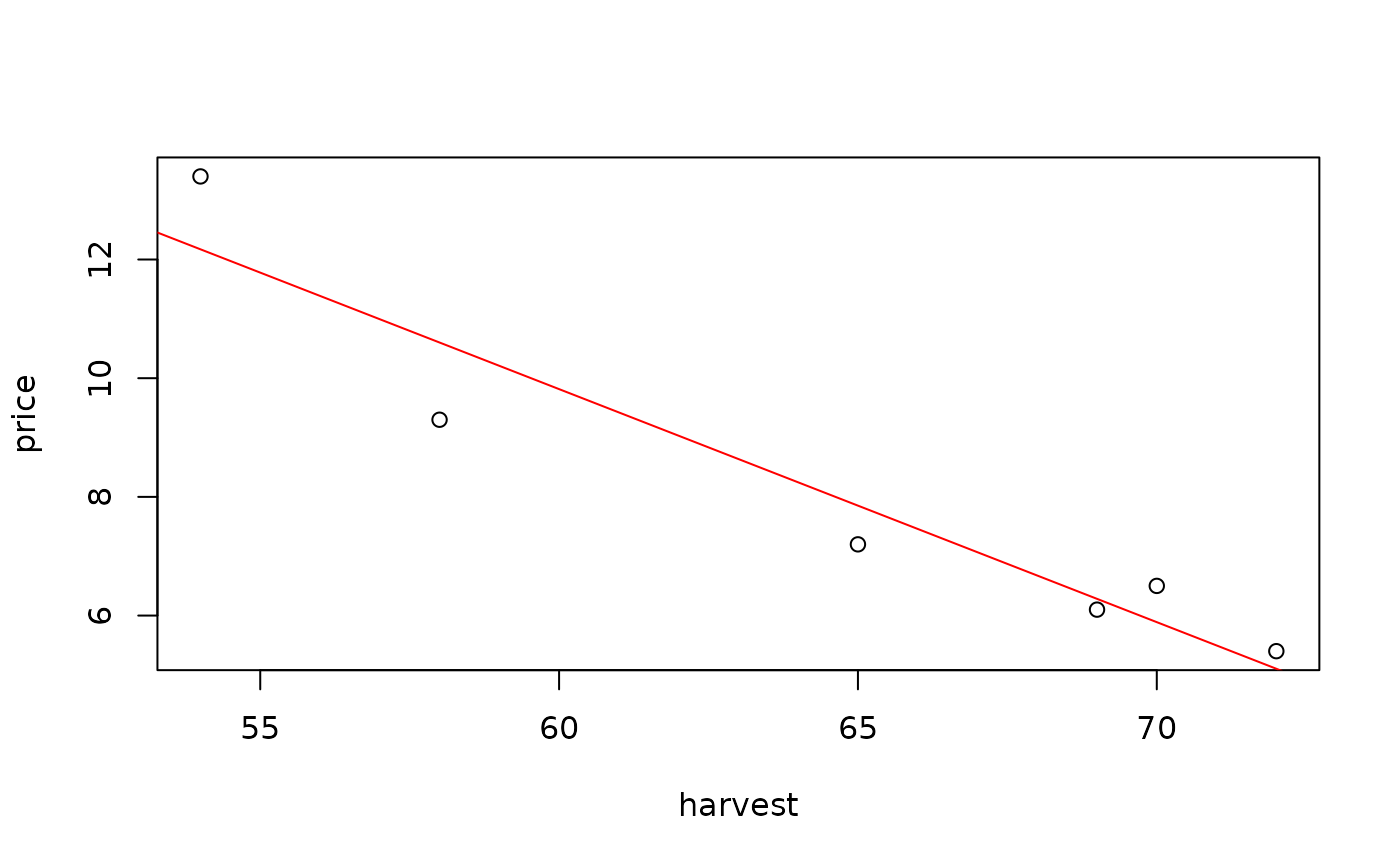
Data for Exercise 9.61
OrangeFormat
A data frame/tibble with six observations on two variables
- harvest
harvest in millions of boxes
- price
average price charged by California growers for a 75-pound box of navel oranges
References
Kitchens, L. J. (2003) Basic Statistics and Data Analysis. Pacific Grove, CA: Brooks/Cole, a division of Thomson Learning.
Examples
plot(price ~ harvest, data = Orange)
model <- lm(price ~ harvest, data = Orange)
abline(model, col = "red")

summary(model)
#>
#> Call:
#> lm(formula = price ~ harvest, data = Orange)
#>
#> Residuals:
#>       1       2       3       4       5       6
#>  0.2963 -0.1817 -1.3012  0.6109 -0.6524  1.2281
#>
#> Coefficients:
#>             Estimate Std. Error t value Pr(>|t|)
#> (Intercept) 33.37622    4.09694   8.147  0.00124 **
#> harvest     -0.39267    0.06303  -6.230  0.00338 **
#> ---
#> Signif. codes:  0 ‘***’ 0.001 ‘**’ 0.01 ‘*’ 0.05 ‘.’ 0.1 ‘ ’ 1
#>
#> Residual standard error: 1.015 on 4 degrees of freedom
#> Multiple R-squared:  0.9066,	Adjusted R-squared:  0.8832
#> F-statistic: 38.81 on 1 and 4 DF,  p-value: 0.003381
#>
rm(model)