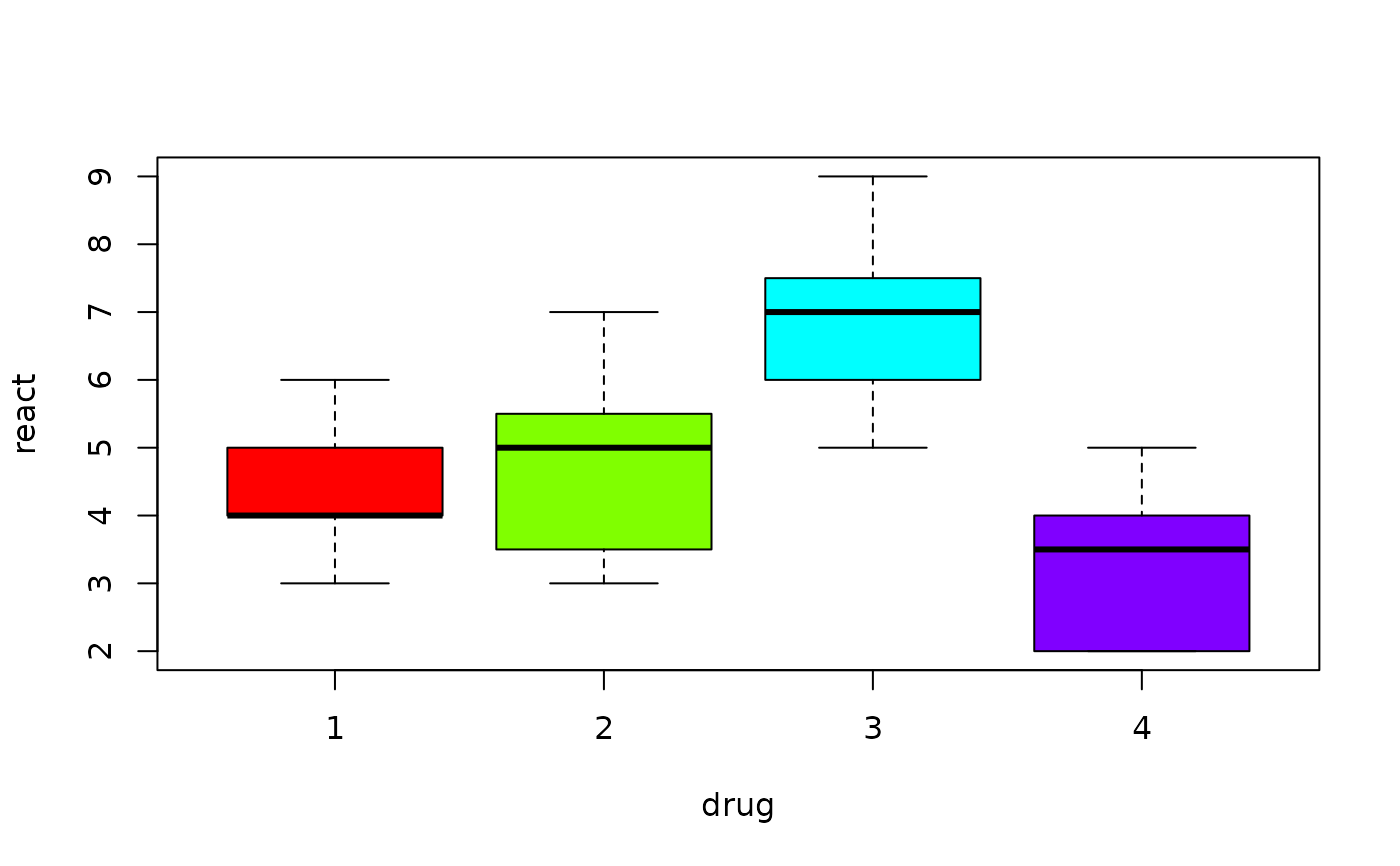
Reaction effects of 4 drugs on 25 subjects with a nervous disorder
Source:R/BSDA-package.R
Nervous.RdData for Example 10.3
NervousFormat
A data frame/tibble with 25 observations on two variables
- react
a numeric vector representing reaction time
- drug
a numeric vector indicating each of the 4 drugs
References
Kitchens, L. J. (2003) Basic Statistics and Data Analysis. Pacific Grove, CA: Brooks/Cole, a division of Thomson Learning.
Examples
boxplot(react ~ drug, data = Nervous, col = rainbow(4))

model <- aov(react ~ factor(drug), data = Nervous)
summary(model)
#>              Df Sum Sq Mean Sq F value  Pr(>F)
#> factor(drug)  3  43.02  14.340   8.179 0.00085 ***
#> Residuals    21  36.82   1.753
#> ---
#> Signif. codes:  0 ‘***’ 0.001 ‘**’ 0.01 ‘*’ 0.05 ‘.’ 0.1 ‘ ’ 1
TukeyHSD(model)
#>   Tukey multiple comparisons of means
#>     95% family-wise confidence level
#>
#> Fit: aov(formula = react ~ factor(drug), data = Nervous)
#>
#> $`factor(drug)`
#>           diff        lwr        upr     p adj
#> 2-1  0.3142857 -1.8467970  2.4753684 0.9768997
#> 3-1  2.4571429  0.2960602  4.6182256 0.0221431
#> 4-1 -1.0666667 -3.3015276  1.1681943 0.5547136
#> 3-2  2.1428571  0.1700676  4.1156467 0.0301086
#> 4-2 -1.3809524 -3.4342969  0.6723921 0.2686560
#> 4-3 -3.5238095 -5.5771540 -1.4704650 0.0005391
#>
plot(TukeyHSD(model), las = 1)
model <- aov(react ~ factor(drug), data = Nervous)
summary(model)
#> Df Sum Sq Mean Sq F value Pr(>F)
#> factor(drug) 3 43.02 14.340 8.179 0.00085 ***
#> Residuals 21 36.82 1.753
#> ---
#> Signif. codes: 0 ‘***’ 0.001 ‘**’ 0.01 ‘*’ 0.05 ‘.’ 0.1 ‘ ’ 1
TukeyHSD(model)
#> Tukey multiple comparisons of means
#> 95% family-wise confidence level
#>
#> Fit: aov(formula = react ~ factor(drug), data = Nervous)
#>
#> $`factor(drug)`
#> diff lwr upr p adj
#> 2-1 0.3142857 -1.8467970 2.4753684 0.9768997
#> 3-1 2.4571429 0.2960602 4.6182256 0.0221431
#> 4-1 -1.0666667 -3.3015276 1.1681943 0.5547136
#> 3-2 2.1428571 0.1700676 4.1156467 0.0301086
#> 4-2 -1.3809524 -3.4342969 0.6723921 0.2686560
#> 4-3 -3.5238095 -5.5771540 -1.4704650 0.0005391
#>
plot(TukeyHSD(model), las = 1)