Data for Exercises 2.28, 9.19, and Example 2.8
NameFormat
A data frame/tibble with 42 observations on three variables
- brand
a factor with levels
Band-Aid,Barbie,Birds Eye,Budweiser,Camel,Campbell,Carlsberg,Coca-Cola,Colgate,Del Monte,Fisher-Price,Gordon's,Green Giant,Guinness,Haagen-Dazs,Heineken,Heinz,Hennessy,Hermes,Hershey,Ivory,Jell-o,Johnnie Walker,Kellogg,Kleenex,Kraft,Louis Vuitton,Marlboro,Nescafe,Nestle,Nivea,Oil of Olay,Pampers,Pepsi-Cola,Planters,Quaker,Sara Lee,Schweppes,Smirnoff,Tampax,Winston, andWrigley's- value
value in billions of dollars
- revenue
revenue in billions of dollars
Source
Financial World.
References
Kitchens, L. J. (2003) Basic Statistics and Data Analysis. Pacific Grove, CA: Brooks/Cole, a division of Thomson Learning.
Examples
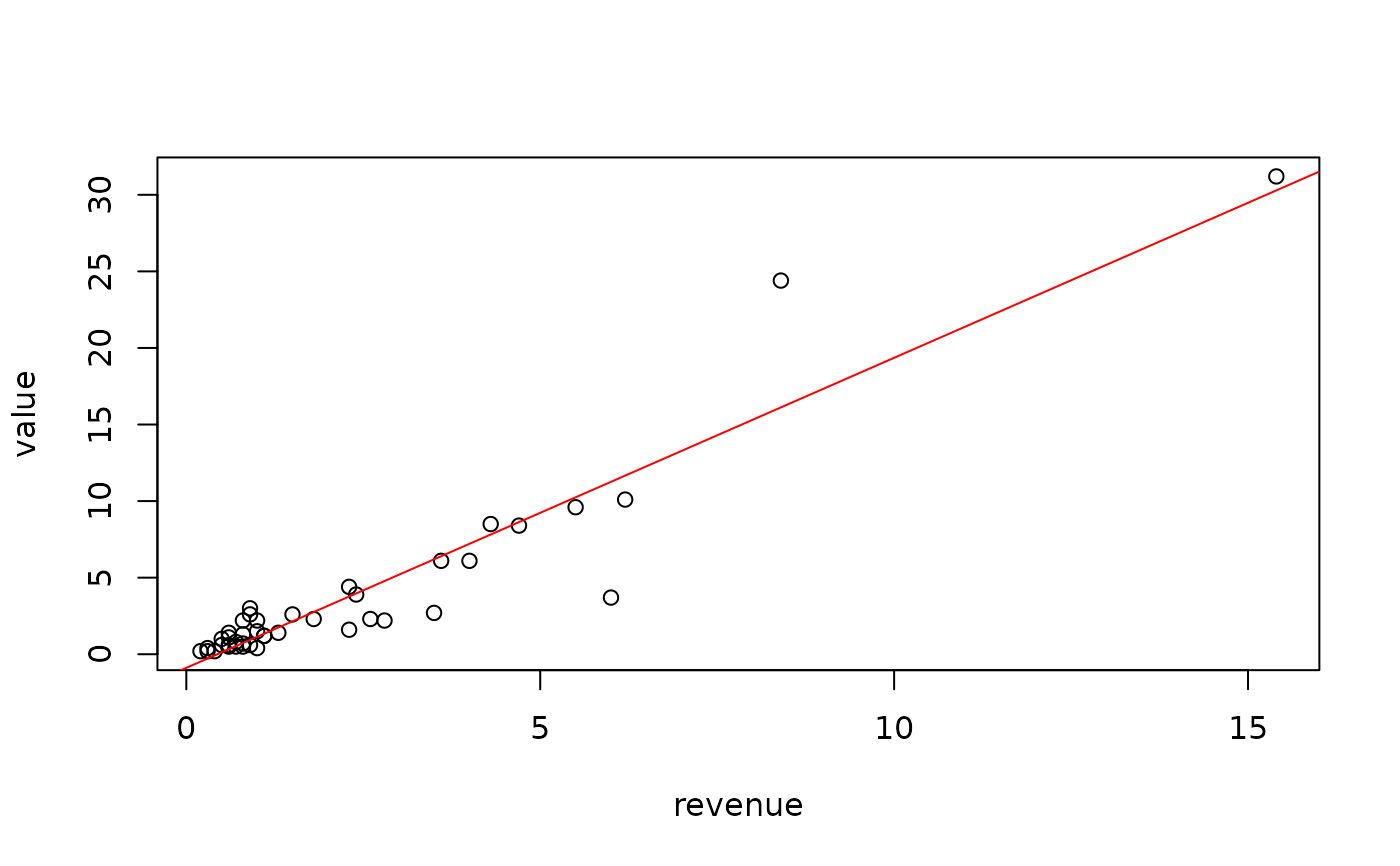
plot(value ~ revenue, data = Name)
model <- lm(value ~ revenue, data = Name)
abline(model, col = "red")

cor(Name$value, Name$revenue)
#> [1] 0.9403903
summary(model)
#>
#> Call:
#> lm(formula = value ~ revenue, data = Name)
#>
#> Residuals:
#>     Min      1Q  Median      3Q     Max
#> -7.5574 -0.3404  0.2231  0.6834  8.2840
#>
#> Coefficients:
#>             Estimate Std. Error t value Pr(>|t|)
#> (Intercept)  -0.8889     0.4174   -2.13   0.0394 *
#> revenue       2.0244     0.1158   17.49   <2e-16 ***
#> ---
#> Signif. codes:  0 ‘***’ 0.001 ‘**’ 0.01 ‘*’ 0.05 ‘.’ 0.1 ‘ ’ 1
#>
#> Residual standard error: 2.096 on 40 degrees of freedom
#> Multiple R-squared:  0.8843,	Adjusted R-squared:  0.8814
#> F-statistic: 305.8 on 1 and 40 DF,  p-value: < 2.2e-16
#>
rm(model)