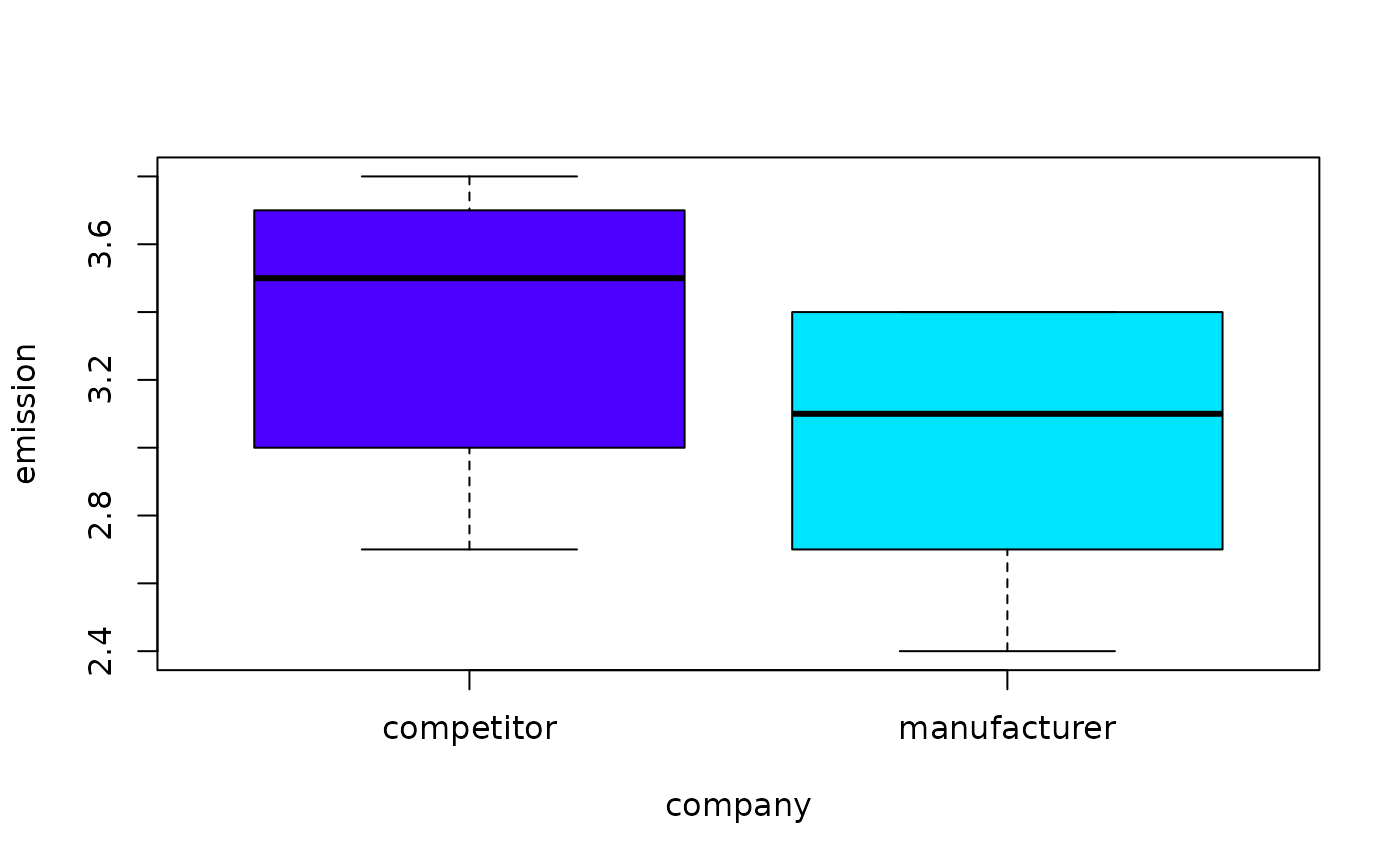
Carbon monoxide emitted by smoke stacks of a manufacturer and a competitor
Source:R/BSDA-package.R
Monoxide.RdData for Exercise 7.45
MonoxideFormat
A data frame/tibble with ten observations on two variables
- company
a vector with values
manufacturerandcompetitor- emission
carbon monoxide emitted
References
Kitchens, L. J. (2003) Basic Statistics and Data Analysis. Pacific Grove, CA: Brooks/Cole, a division of Thomson Learning.
Examples
boxplot(emission ~ company, data = Monoxide, col = topo.colors(2))

t.test(emission ~ company, data = Monoxide)
#>
#> 	Welch Two Sample t-test
#>
#> data:  emission by company
#> t = 2.1187, df = 16.842, p-value = 0.04929
#> alternative hypothesis: true difference in means between group competitor and group manufacturer is not equal to 0
#> 95 percent confidence interval:
#>  0.001326539 0.760895683
#> sample estimates:
#>   mean in group competitor mean in group manufacturer
#>                   3.370000                   2.988889
#>
wilcox.test(emission ~ company, data = Monoxide)
#> Warning: cannot compute exact p-value with ties
#>
#> 	Wilcoxon rank sum test with continuity correction
#>
#> data:  emission by company
#> W = 71, p-value = 0.03617
#> alternative hypothesis: true location shift is not equal to 0
#>
if (FALSE) {
library(ggplot2)
ggplot2::ggplot(data = Monoxide, aes(x = company, y = emission)) +
           geom_boxplot() +
           theme_bw()
}
t.test(emission ~ company, data = Monoxide)
#>
#> Welch Two Sample t-test
#>
#> data: emission by company
#> t = 2.1187, df = 16.842, p-value = 0.04929
#> alternative hypothesis: true difference in means between group competitor and group manufacturer is not equal to 0
#> 95 percent confidence interval:
#> 0.001326539 0.760895683
#> sample estimates:
#> mean in group competitor mean in group manufacturer
#> 3.370000 2.988889
#>
wilcox.test(emission ~ company, data = Monoxide)
#> Warning: cannot compute exact p-value with ties
#>
#> Wilcoxon rank sum test with continuity correction
#>
#> data: emission by company
#> W = 71, p-value = 0.03617
#> alternative hypothesis: true location shift is not equal to 0
#>
if (FALSE) {
library(ggplot2)
ggplot2::ggplot(data = Monoxide, aes(x = company, y = emission)) +
geom_boxplot() +
theme_bw()
}