Data for Exercise 9.24, Example 9.1, and Example 9.6
MathproFormat
A data frame/tibble with 51 observations on four variables
- state
a factor with levels
Conn,D.C.,Del,Ga,Hawaii,Ind,Maine,Mass,Md,N.C.,N.H.,N.J.,N.Y.,Ore,Pa,R.I.,S.C.,Va, andVt- sat_math
SAT math scores for high school seniors
- profic
math proficiency scores for eigth graders
- group
a numeric vector
Source
National Assessment of Educational Progress and The College Board.
References
Kitchens, L. J. (2003) Basic Statistics and Data Analysis. Pacific Grove, CA: Brooks/Cole, a division of Thomson Learning.
Examples
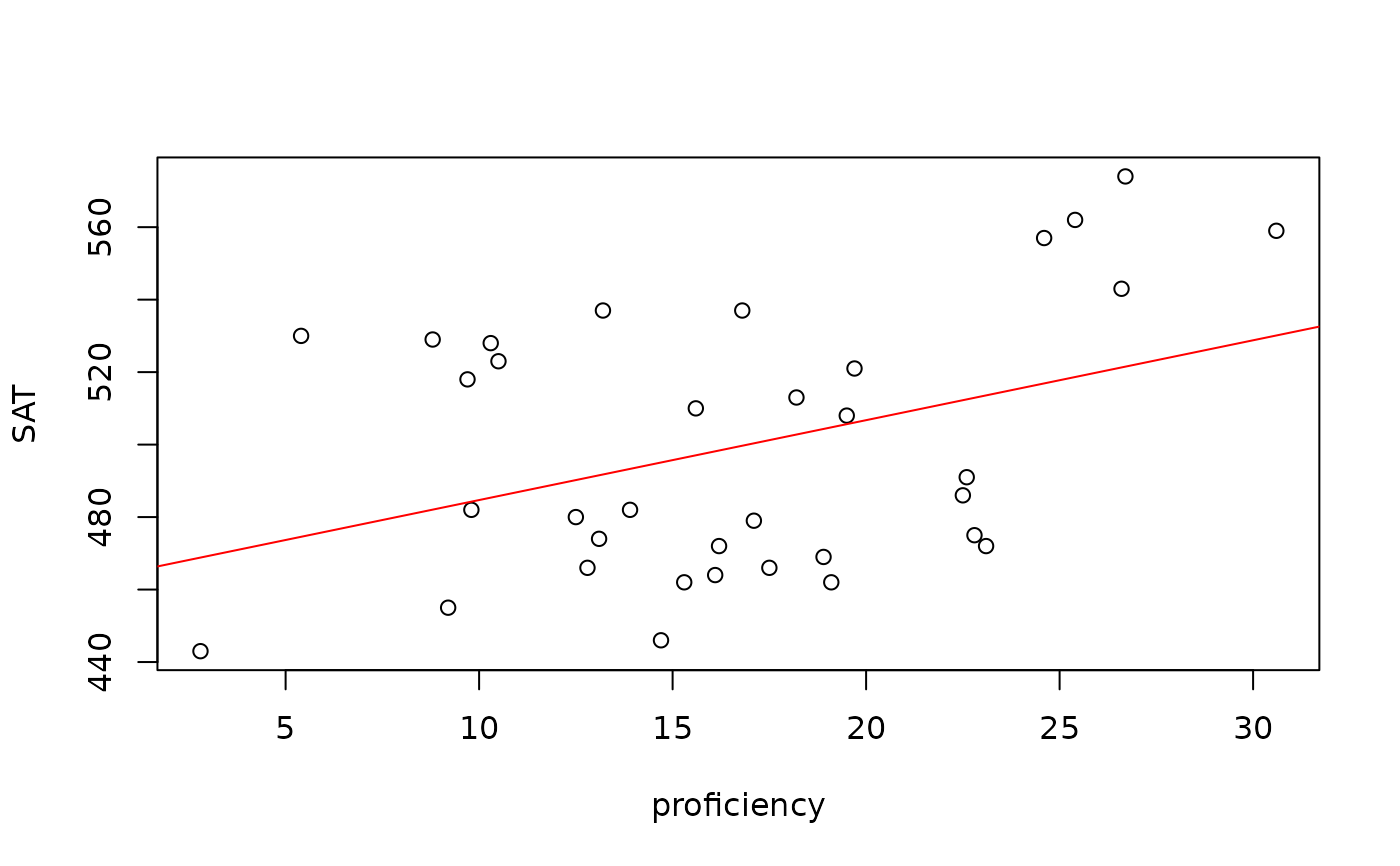
model <- lm(sat_math ~ profic, data = Mathpro)
plot(sat_math ~ profic, data = Mathpro, ylab = "SAT", xlab = "proficiency")
abline(model, col = "red")

summary(model)
#>
#> Call:
#> lm(formula = sat_math ~ profic, data = Mathpro)
#>
#> Residuals:
#>    Min     1Q Median     3Q    Max
#> -49.06 -27.15 -10.21  35.58  55.44
#>
#> Coefficients:
#>             Estimate Std. Error t value Pr(>|t|)
#> (Intercept) 462.6561    16.2059  28.549   <2e-16 ***
#> profic        2.2043     0.9117   2.418   0.0213 *
#> ---
#> Signif. codes:  0 ‘***’ 0.001 ‘**’ 0.01 ‘*’ 0.05 ‘.’ 0.1 ‘ ’ 1
#>
#> Residual standard error: 34.06 on 33 degrees of freedom
#>   (16 observations deleted due to missingness)
#> Multiple R-squared:  0.1505,	Adjusted R-squared:  0.1248
#> F-statistic: 5.846 on 1 and 33 DF,  p-value: 0.02129
#>
rm(model)