Standardized math competency for a group of entering freshmen at a small community college
Source:R/BSDA-package.R
Mathcomp.RdData for Exercise 5.26
MathcompFormat
A data frame/tibble with 31 observations one variable
- score
scores of 31 entering freshmen at a community college on a national standardized test
References
Kitchens, L. J. (2003) Basic Statistics and Data Analysis. Pacific Grove, CA: Brooks/Cole, a division of Thomson Learning.
Examples
stem(Mathcomp$score)
#>
#> The decimal point is 1 digit(s) to the right of the |
#>
#> 4 | 6
#> 5 | 035
#> 6 | 11557889
#> 7 | 0003355567
#> 8 | 2357
#> 9 | 0025
#> 10 | 0
#>
EDA(Mathcomp$score)
#> [1] "Mathcomp$score"
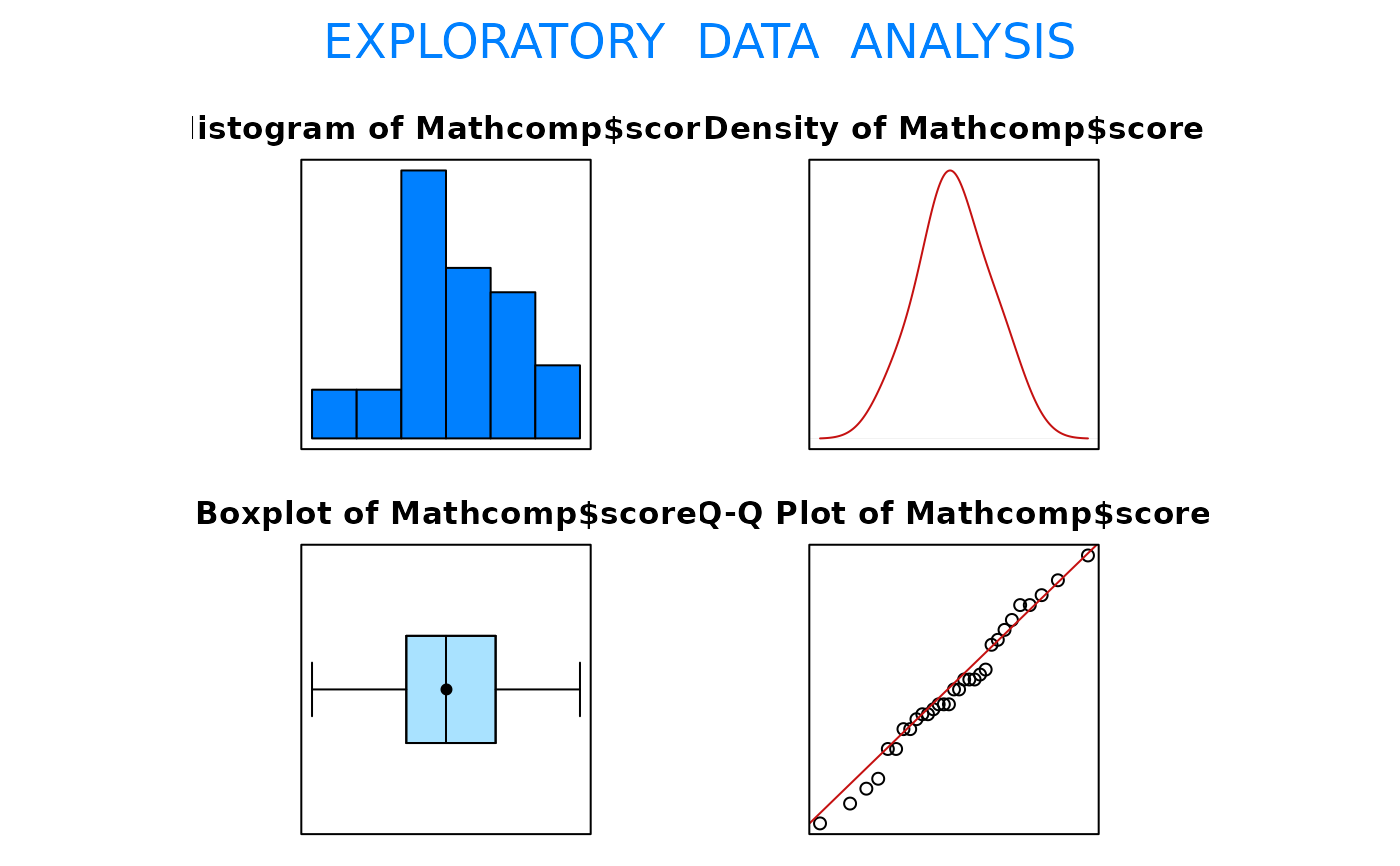 #> Size (n) Missing Minimum 1st Qu Mean Median TrMean 3rd Qu
#> 31.000 0.000 46.000 65.000 73.097 73.000 73.103 83.000
#> Max. Stdev. Var. SE Mean I.Q.R. Range Kurtosis Skewness
#> 100.000 13.212 174.557 2.373 18.000 54.000 -0.600 0.015
#> SW p-val
#> 0.886
#> Size (n) Missing Minimum 1st Qu Mean Median TrMean 3rd Qu
#> 31.000 0.000 46.000 65.000 73.097 73.000 73.103 83.000
#> Max. Stdev. Var. SE Mean I.Q.R. Range Kurtosis Skewness
#> 100.000 13.212 174.557 2.373 18.000 54.000 -0.600 0.015
#> SW p-val
#> 0.886