Data for Exercise 1.69
MathFormat
A data frame/tibble with 30 observations on one variable
- score
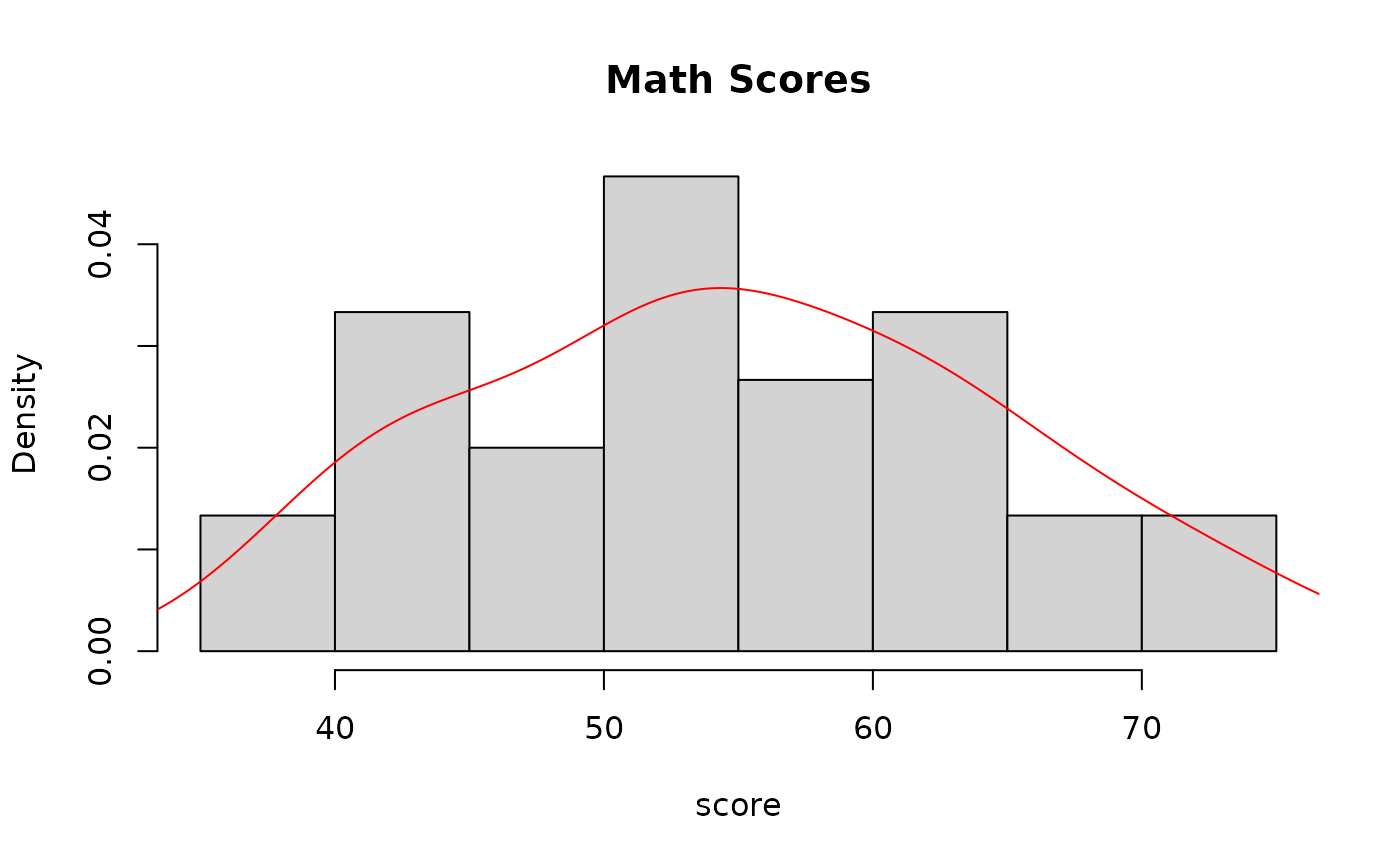
scores on a standardized test for 30 tenth graders
References
Kitchens, L. J. (2003) Basic Statistics and Data Analysis. Pacific Grove, CA: Brooks/Cole, a division of Thomson Learning.
Examples
stem(Math$score)
#>
#>   The decimal point is 1 digit(s) to the right of the |
#>
#>   3 | 8
#>   4 | 02234
#>   4 | 599
#>   5 | 0123444
#>   5 | 5789
#>   6 | 01234
#>   6 | 57
#>   7 | 01
#>   7 | 5
#>
hist(Math$score, main = "Math Scores", xlab = "score", freq = FALSE)
lines(density(Math$score), col = "red")

CharlieZ <- (62 - mean(Math$score))/sd(Math$score)
CharlieZ
#> [1] 0.7284843
scale(Math$score)[which(Math$score == 62)]
#> [1] 0.7284843
CharlieZ <- (62 - mean(Math$score))/sd(Math$score)
CharlieZ
#> [1] 0.7284843
scale(Math$score)[which(Math$score == 62)]
#> [1] 0.7284843