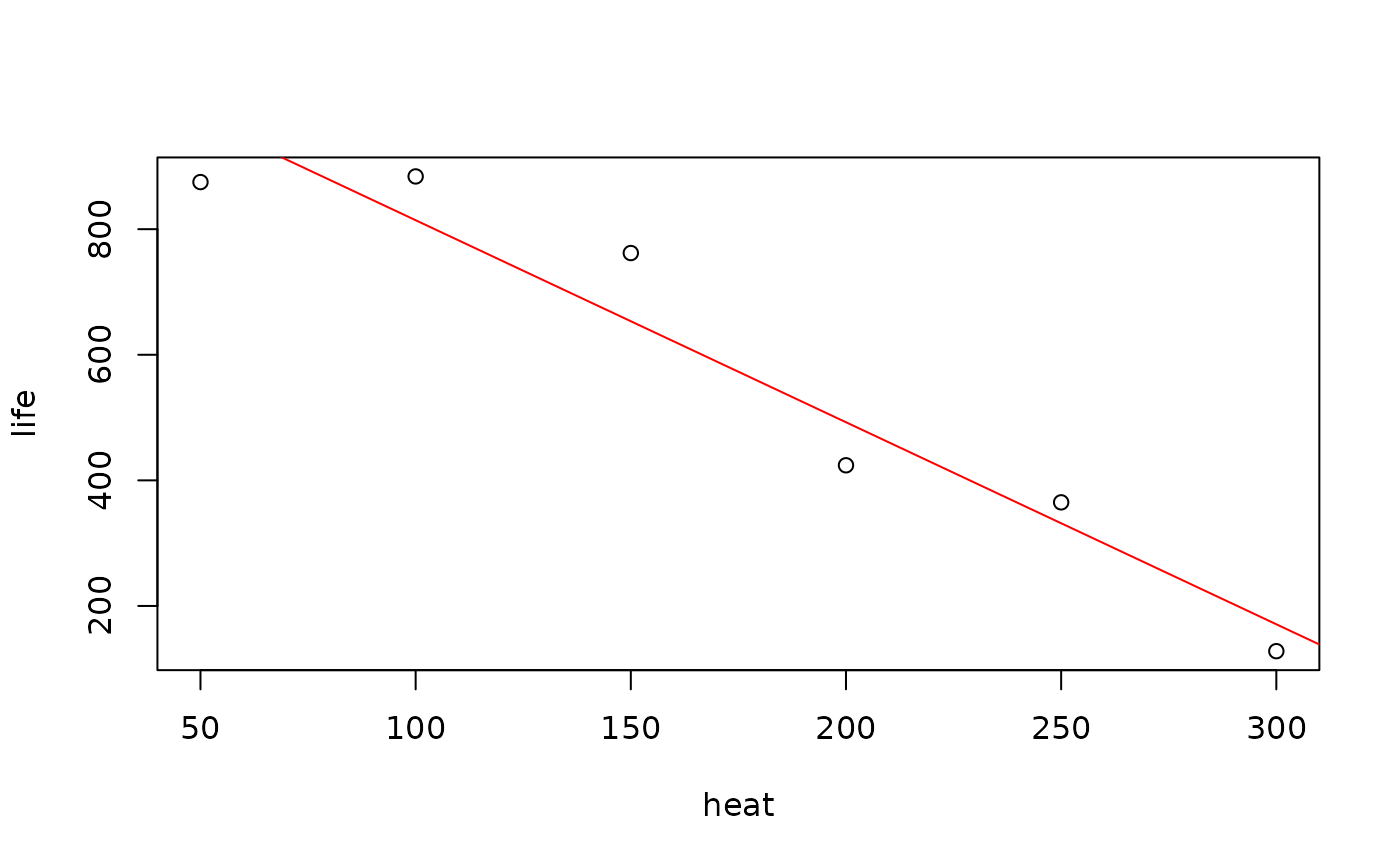
Life span of electronic components used in a spacecraft versus heat
Source:R/BSDA-package.R
Lifespan.RdData for Exercise 2.4, 2.37, and 2.49
LifespanFormat
A data frame/tibble with six observations two variables
- heat
temperature (in Celcius)
- life
lifespan of component (in hours)
References
Kitchens, L. J. (2003) Basic Statistics and Data Analysis. Pacific Grove, CA: Brooks/Cole, a division of Thomson Learning.
Examples
plot(life ~ heat, data = Lifespan)
model <- lm(life ~ heat, data = Lifespan)
abline(model, col = "red")

resid(model)
#>          1          2          3          4          5          6
#> -100.14286   69.71429  108.57143  -68.57143   33.28571  -42.85714
sum((resid(model))^2)
#> [1] 34323.14
anova(model)
#> Analysis of Variance Table
#>
#> Response: life
#>           Df Sum Sq Mean Sq F value   Pr(>F)
#> heat       1 452813  452813  52.771 0.001907 **
#> Residuals  4  34323    8581
#> ---
#> Signif. codes:  0 ‘***’ 0.001 ‘**’ 0.01 ‘*’ 0.05 ‘.’ 0.1 ‘ ’ 1
rm(model)
resid(model)
#> 1 2 3 4 5 6
#> -100.14286 69.71429 108.57143 -68.57143 33.28571 -42.85714
sum((resid(model))^2)
#> [1] 34323.14
anova(model)
#> Analysis of Variance Table
#>
#> Response: life
#> Df Sum Sq Mean Sq F value Pr(>F)
#> heat 1 452813 452813 52.771 0.001907 **
#> Residuals 4 34323 8581
#> ---
#> Signif. codes: 0 ‘***’ 0.001 ‘**’ 0.01 ‘*’ 0.05 ‘.’ 0.1 ‘ ’ 1
rm(model)