Data for Exercise 1.31
LifeFormat
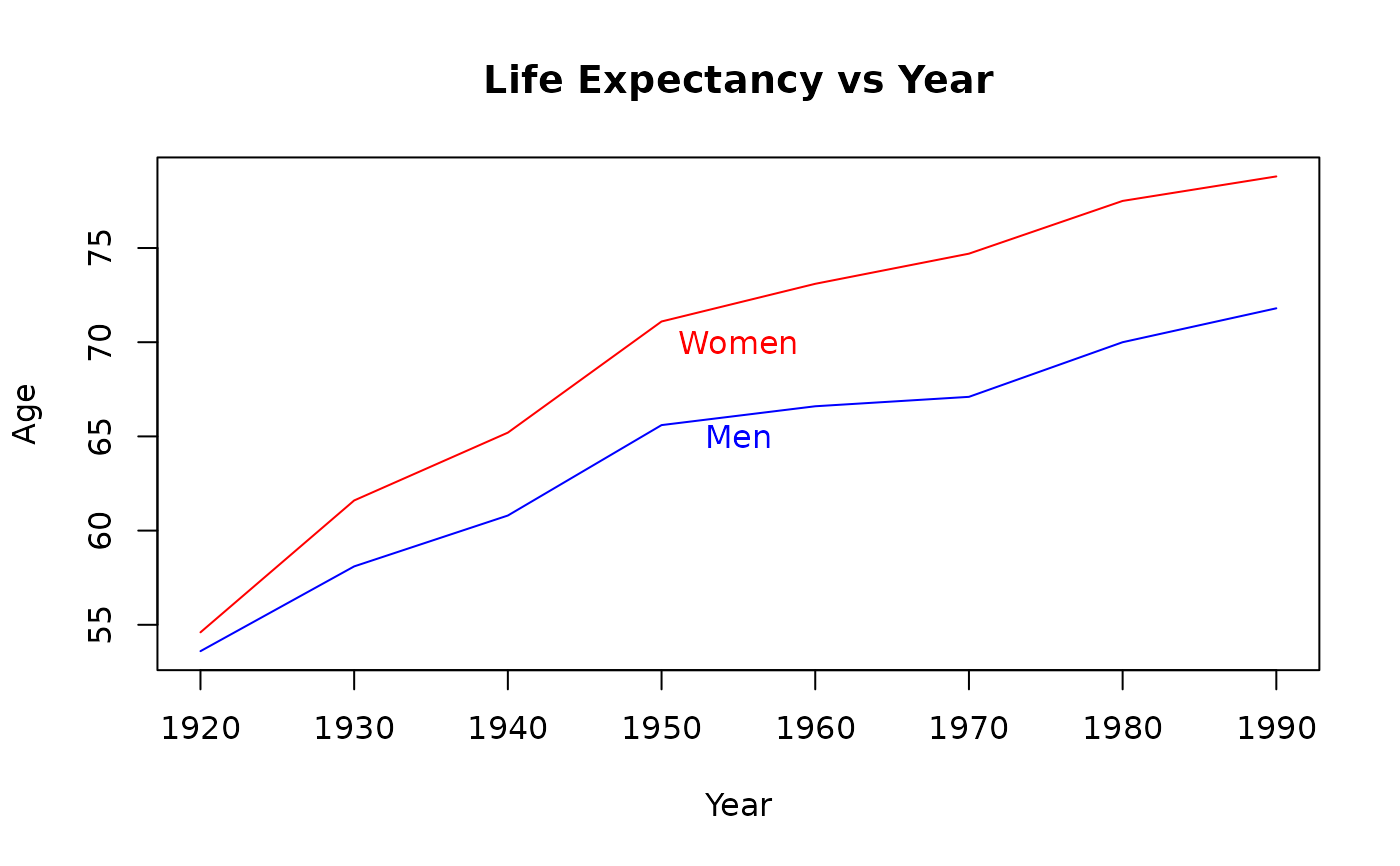
A data frame/tibble with eight observations on three variables
- year
a numeric vector indicating year
- men
life expectancy for men (in years)
- women
life expectancy for women (in years)
Source
National Center for Health Statistics.
References
Kitchens, L. J. (2003) Basic Statistics and Data Analysis. Pacific Grove, CA: Brooks/Cole, a division of Thomson Learning.