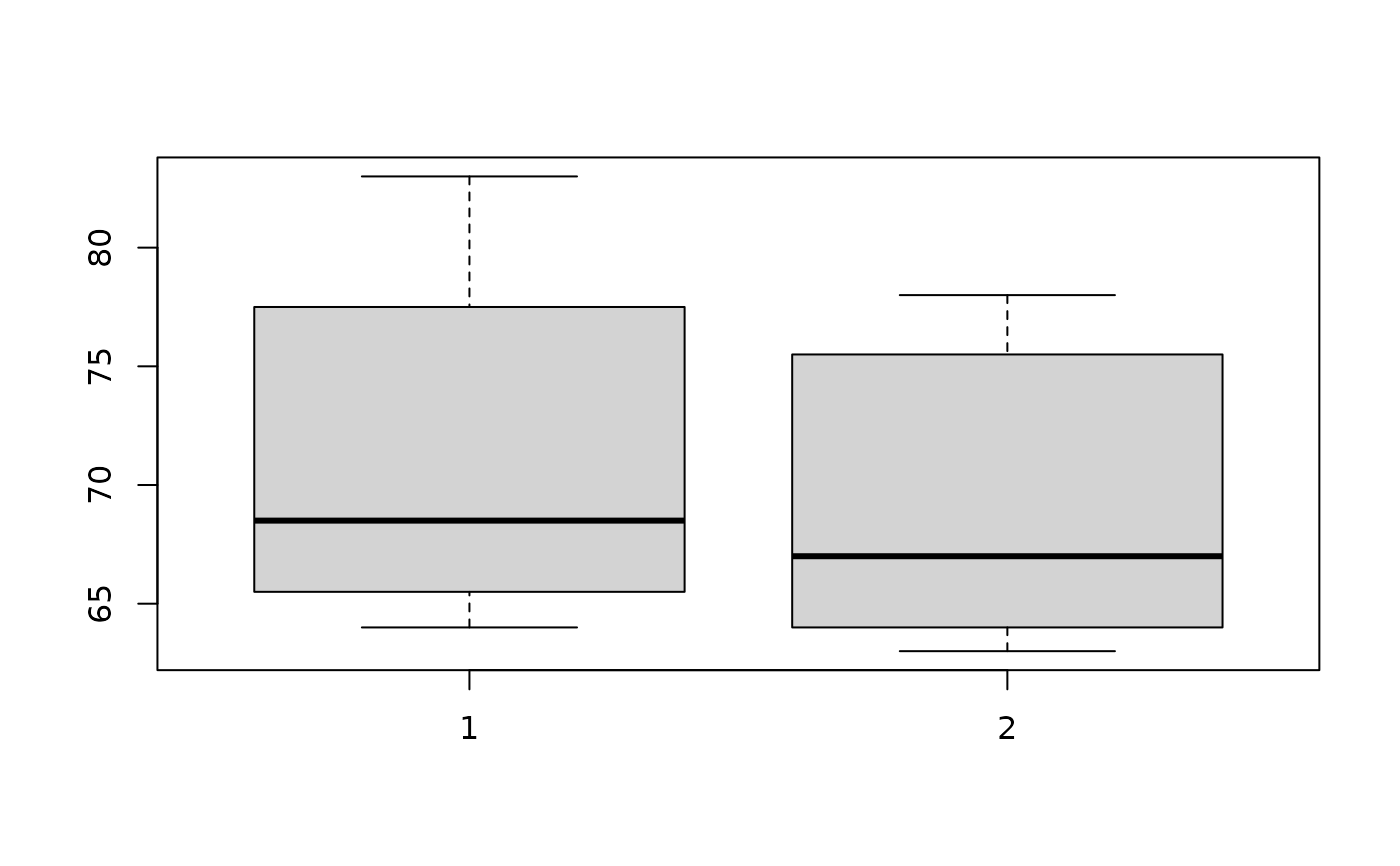
Reading scores for first grade children who attended kindergarten versus those who did not
Source:R/BSDA-package.R
Kinder.RdData for Exercise 7.68
KinderFormat
A data frame/tibble with eight observations on three variables
- pair
a numeric indicator of pair
- kinder
reading score of kids who went to kindergarten
- nokinder
reading score of kids who did not go to kindergarten
References
Kitchens, L. J. (2003) Basic Statistics and Data Analysis. Pacific Grove, CA: Brooks/Cole, a division of Thomson Learning.
Examples
boxplot(Kinder$kinder, Kinder$nokinder)
 diff <- Kinder$kinder - Kinder$nokinder
qqnorm(diff)
qqline(diff)
diff <- Kinder$kinder - Kinder$nokinder
qqnorm(diff)
qqline(diff)
 shapiro.test(diff)
#>
#> Shapiro-Wilk normality test
#>
#> data: diff
#> W = 0.87923, p-value = 0.1852
#>
t.test(diff)
#>
#> One Sample t-test
#>
#> data: diff
#> t = 2.1166, df = 7, p-value = 0.07208
#> alternative hypothesis: true mean is not equal to 0
#> 95 percent confidence interval:
#> -0.2343599 4.2343599
#> sample estimates:
#> mean of x
#> 2
#>
rm(diff)
shapiro.test(diff)
#>
#> Shapiro-Wilk normality test
#>
#> data: diff
#> W = 0.87923, p-value = 0.1852
#>
t.test(diff)
#>
#> One Sample t-test
#>
#> data: diff
#> t = 2.1166, df = 7, p-value = 0.07208
#> alternative hypothesis: true mean is not equal to 0
#> 95 percent confidence interval:
#> -0.2343599 4.2343599
#> sample estimates:
#> mean of x
#> 2
#>
rm(diff)