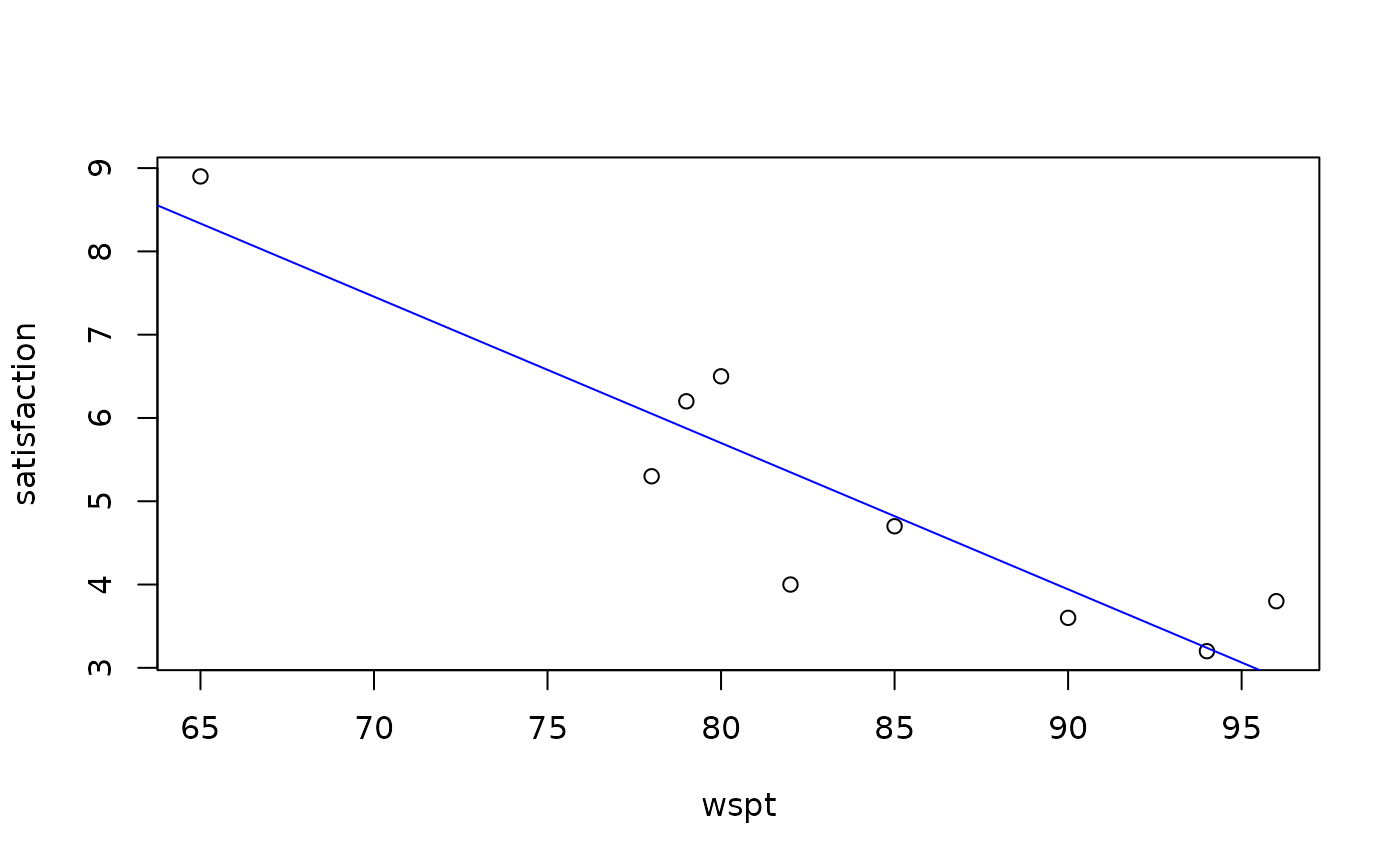
Data for Exercise 9.60
JobsatFormat
A data frame/tibble with nine observations on two variables
- wspt
Wilson Stress Profile score for teachers
- satisfaction
job satisfaction score
References
Kitchens, L. J. (2003) Basic Statistics and Data Analysis. Pacific Grove, CA: Brooks/Cole, a division of Thomson Learning.
Examples
plot(satisfaction ~ wspt, data = Jobsat)
model <- lm(satisfaction ~ wspt, data = Jobsat)
abline(model, col = "blue")

summary(model)
#>
#> Call:
#> lm(formula = satisfaction ~ wspt, data = Jobsat)
#>
#> Residuals:
#>     Min      1Q  Median      3Q     Max
#> -1.3481 -0.3426 -0.0398  0.5652  0.9116
#>
#> Coefficients:
#>             Estimate Std. Error t value Pr(>|t|)
#> (Intercept) 19.75457    2.48050   7.964 9.38e-05 ***
#> wspt        -0.17569    0.02964  -5.928 0.000583 ***
#> ---
#> Signif. codes:  0 ‘***’ 0.001 ‘**’ 0.01 ‘*’ 0.05 ‘.’ 0.1 ‘ ’ 1
#>
#> Residual standard error: 0.7939 on 7 degrees of freedom
#> Multiple R-squared:  0.8339,	Adjusted R-squared:  0.8102
#> F-statistic: 35.14 on 1 and 7 DF,  p-value: 0.0005826
#>
rm(model)