Data for Examples 1.15 and 5.19
IrisesFormat
A data frame/tibble with 150 observations on five variables
- sepal_length
sepal length (in cm)
- sepal_width
sepal width (in cm)
- petal_length
petal length (in cm)
- petal_width
petal width (in cm)
- species
a factor with levels
setosa,versicolor, andvirginica
Source
Fisher, R. A. (1936) The use of multiple measurements in taxonomic problems. Annals of Eugenics, 7, Part II, 179-188.
References
Kitchens, L. J. (2003) Basic Statistics and Data Analysis. Pacific Grove, CA: Brooks/Cole, a division of Thomson Learning.
Examples
tapply(Irises$sepal_length, Irises$species, mean)
#> setosa versicolor virginica
#> 5.006 5.936 6.588
t.test(Irises$sepal_length[Irises$species == "setosa"], conf.level = 0.99)
#>
#> One Sample t-test
#>
#> data: Irises$sepal_length[Irises$species == "setosa"]
#> t = 100.42, df = 49, p-value < 2.2e-16
#> alternative hypothesis: true mean is not equal to 0
#> 99 percent confidence interval:
#> 4.872406 5.139594
#> sample estimates:
#> mean of x
#> 5.006
#>
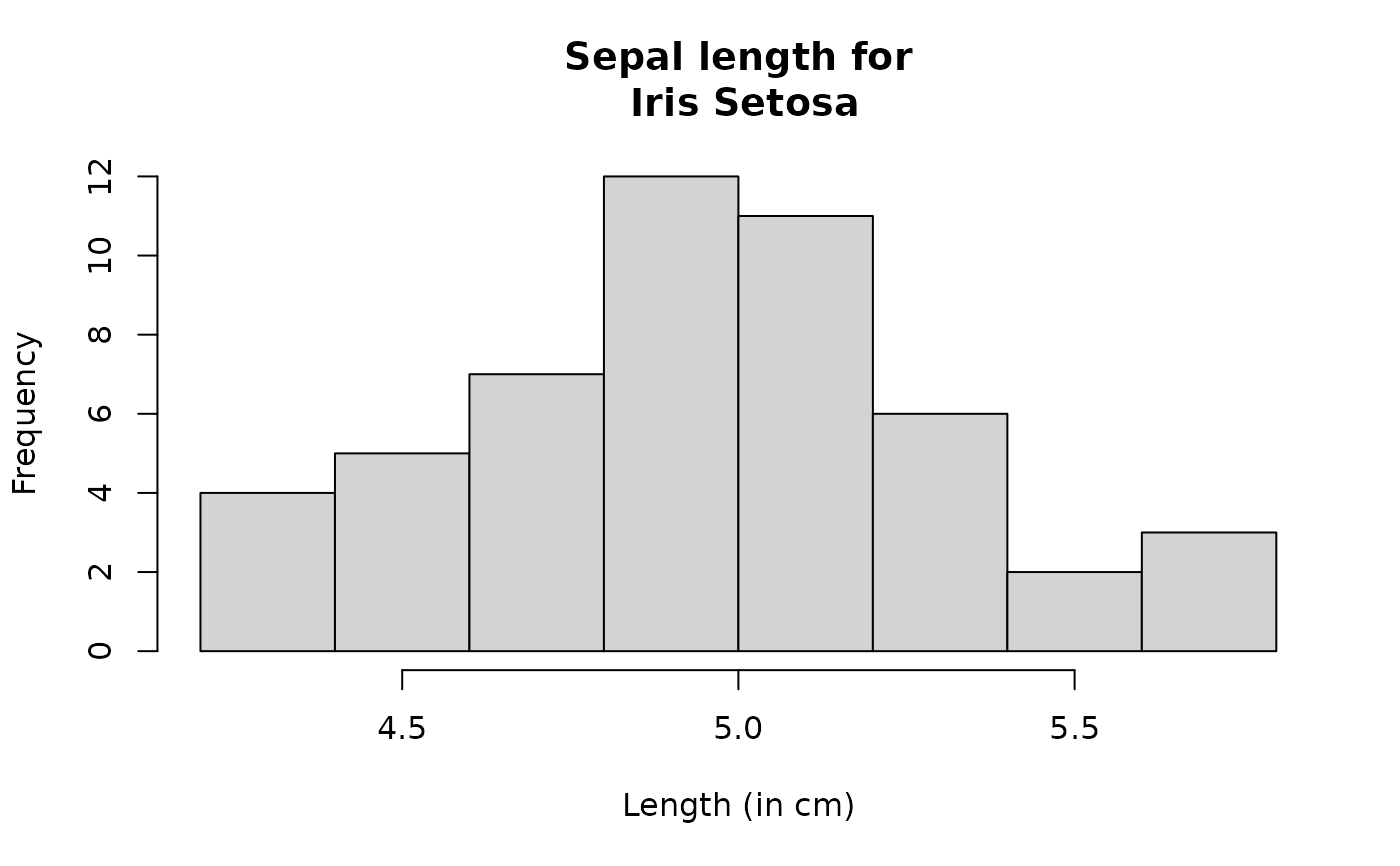
hist(Irises$sepal_length[Irises$species == "setosa"],
main = "Sepal length for\n Iris Setosa",
xlab = "Length (in cm)")
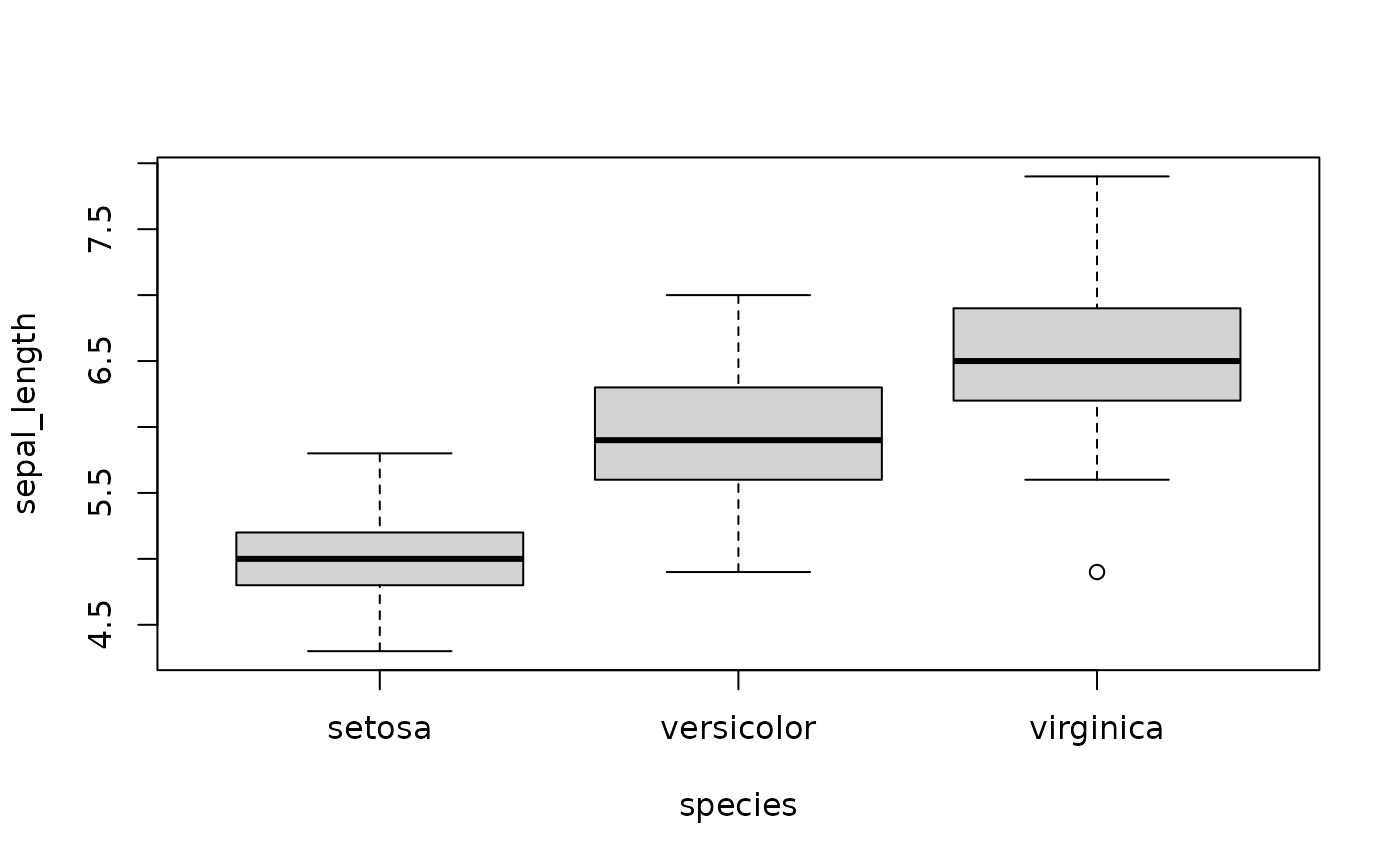
 boxplot(sepal_length ~ species, data = Irises)