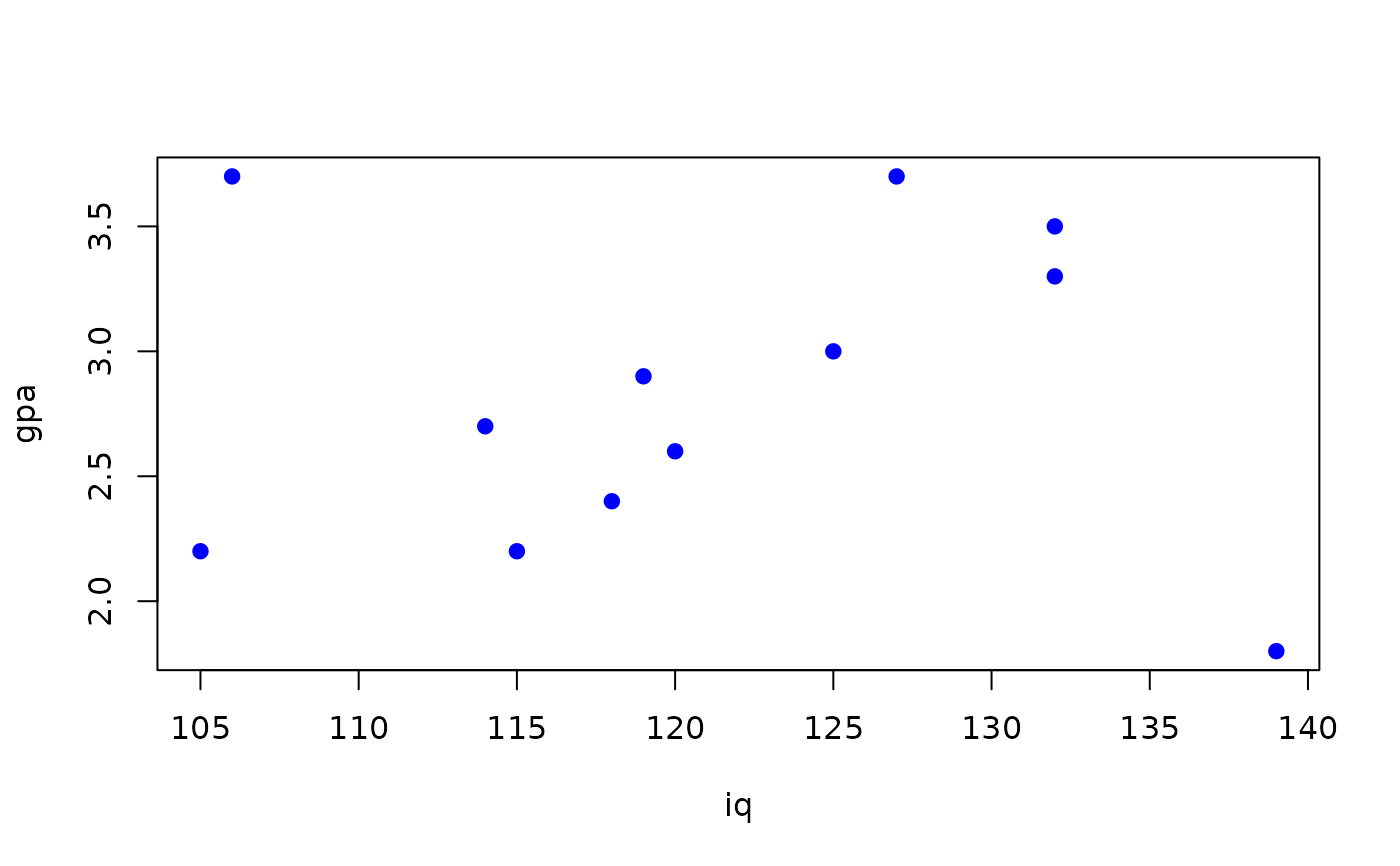
Data for Exercises 9.51 and 9.52
IqgpaFormat
A data frame/tibble with 12 observations on two variables
- iq
IQ scores
- gpa
Grade point average
References
Kitchens, L. J. (2003) Basic Statistics and Data Analysis. Pacific Grove, CA: Brooks/Cole, a division of Thomson Learning.
Examples
plot(gpa ~ iq, data = Iqgpa, col = "blue", pch = 19)

model <- lm(gpa ~ iq, data = Iqgpa)
summary(model)
#>
#> Call:
#> lm(formula = gpa ~ iq, data = Iqgpa)
#>
#> Residuals:
#>      Min       1Q   Median       3Q      Max
#> -1.07841 -0.46768 -0.02206  0.48912  0.90423
#>
#> Coefficients:
#>             Estimate Std. Error t value Pr(>|t|)
#> (Intercept) 2.530328   2.305324   1.098    0.298
#> iq          0.002504   0.018988   0.132    0.898
#>
#> Residual standard error: 0.6572 on 10 degrees of freedom
#> Multiple R-squared:  0.001736,	Adjusted R-squared:  -0.09809
#> F-statistic: 0.01739 on 1 and 10 DF,  p-value: 0.8977
#>
rm(model)