Data for Exercise 9.50
InsulateFormat
A data frame/tibble with ten observations on two variables
- temp
outside temperature (in degrees Celcius)
- loss
heat loss (in BTUs)
References
Kitchens, L. J. (2003) Basic Statistics and Data Analysis. Pacific Grove, CA: Brooks/Cole, a division of Thomson Learning.
Examples
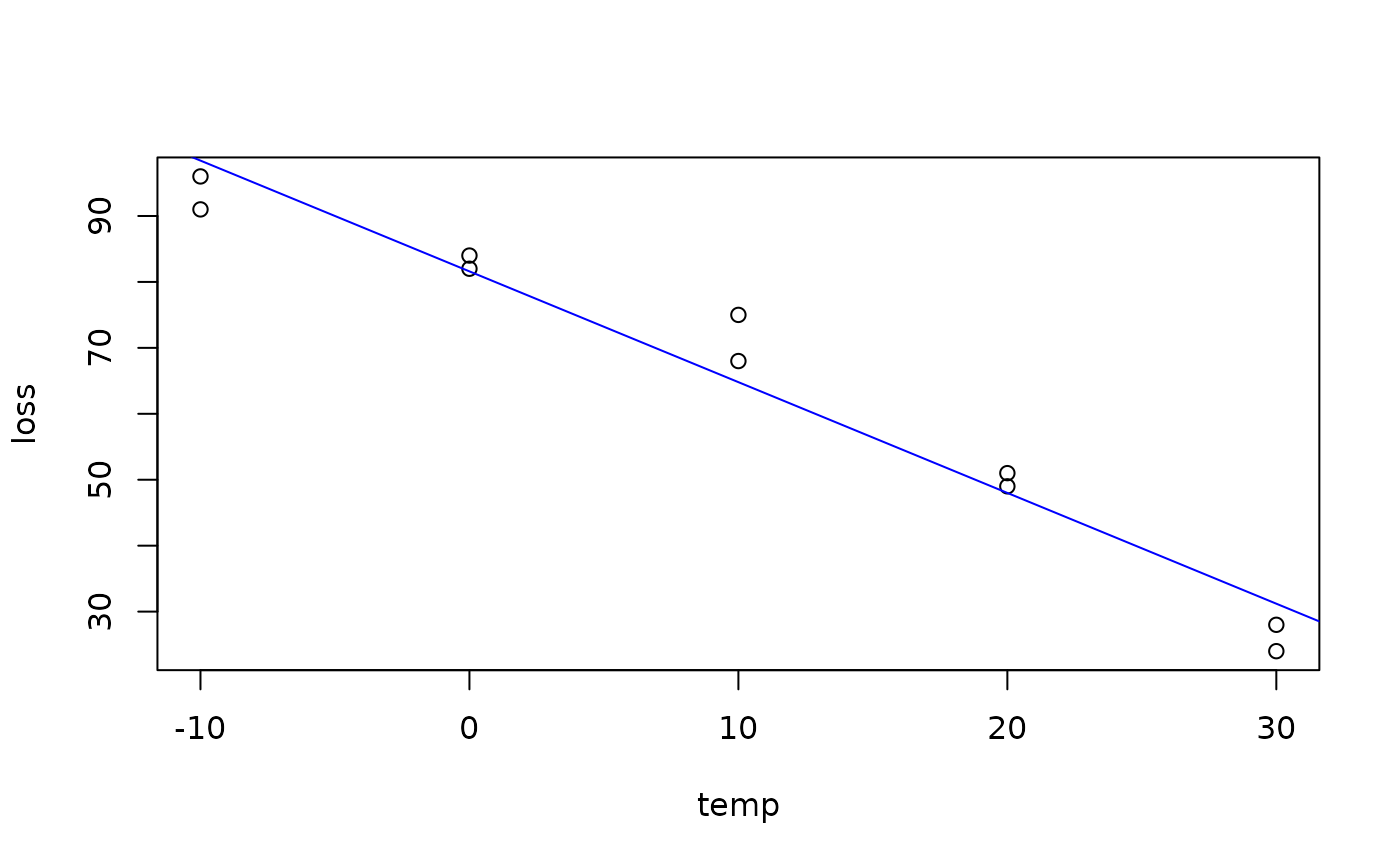
plot(loss ~ temp, data = Insulate)
model <- lm(loss ~ temp, data = Insulate)
abline(model, col = "blue")

summary(model)
#>
#> Call:
#> lm(formula = loss ~ temp, data = Insulate)
#>
#> Residuals:
#>    Min     1Q Median     3Q    Max
#>  -7.40  -3.00   0.70   2.85  10.20
#>
#> Coefficients:
#>             Estimate Std. Error t value Pr(>|t|)
#> (Intercept)  81.6000     2.1772   37.48 2.82e-10 ***
#> temp         -1.6800     0.1257  -13.37 9.39e-07 ***
#> ---
#> Signif. codes:  0 ‘***’ 0.001 ‘**’ 0.01 ‘*’ 0.05 ‘.’ 0.1 ‘ ’ 1
#>
#> Residual standard error: 5.621 on 8 degrees of freedom
#> Multiple R-squared:  0.9571,	Adjusted R-squared:  0.9518
#> F-statistic: 178.6 on 1 and 8 DF,  p-value: 9.394e-07
#>

if (FALSE) {
library(ggplot2)
ggplot2::ggplot(data = Insulate, aes(x = temp, y = loss)) +
           geom_point() +
           geom_smooth(method = "lm", se = FALSE) +
           theme_bw()
}
summary(model)
#>
#> Call:
#> lm(formula = loss ~ temp, data = Insulate)
#>
#> Residuals:
#> Min 1Q Median 3Q Max
#> -7.40 -3.00 0.70 2.85 10.20
#>
#> Coefficients:
#> Estimate Std. Error t value Pr(>|t|)
#> (Intercept) 81.6000 2.1772 37.48 2.82e-10 ***
#> temp -1.6800 0.1257 -13.37 9.39e-07 ***
#> ---
#> Signif. codes: 0 ‘***’ 0.001 ‘**’ 0.01 ‘*’ 0.05 ‘.’ 0.1 ‘ ’ 1
#>
#> Residual standard error: 5.621 on 8 degrees of freedom
#> Multiple R-squared: 0.9571, Adjusted R-squared: 0.9518
#> F-statistic: 178.6 on 1 and 8 DF, p-value: 9.394e-07
#>
if (FALSE) {
library(ggplot2)
ggplot2::ggplot(data = Insulate, aes(x = temp, y = loss)) +
geom_point() +
geom_smooth(method = "lm", se = FALSE) +
theme_bw()
}