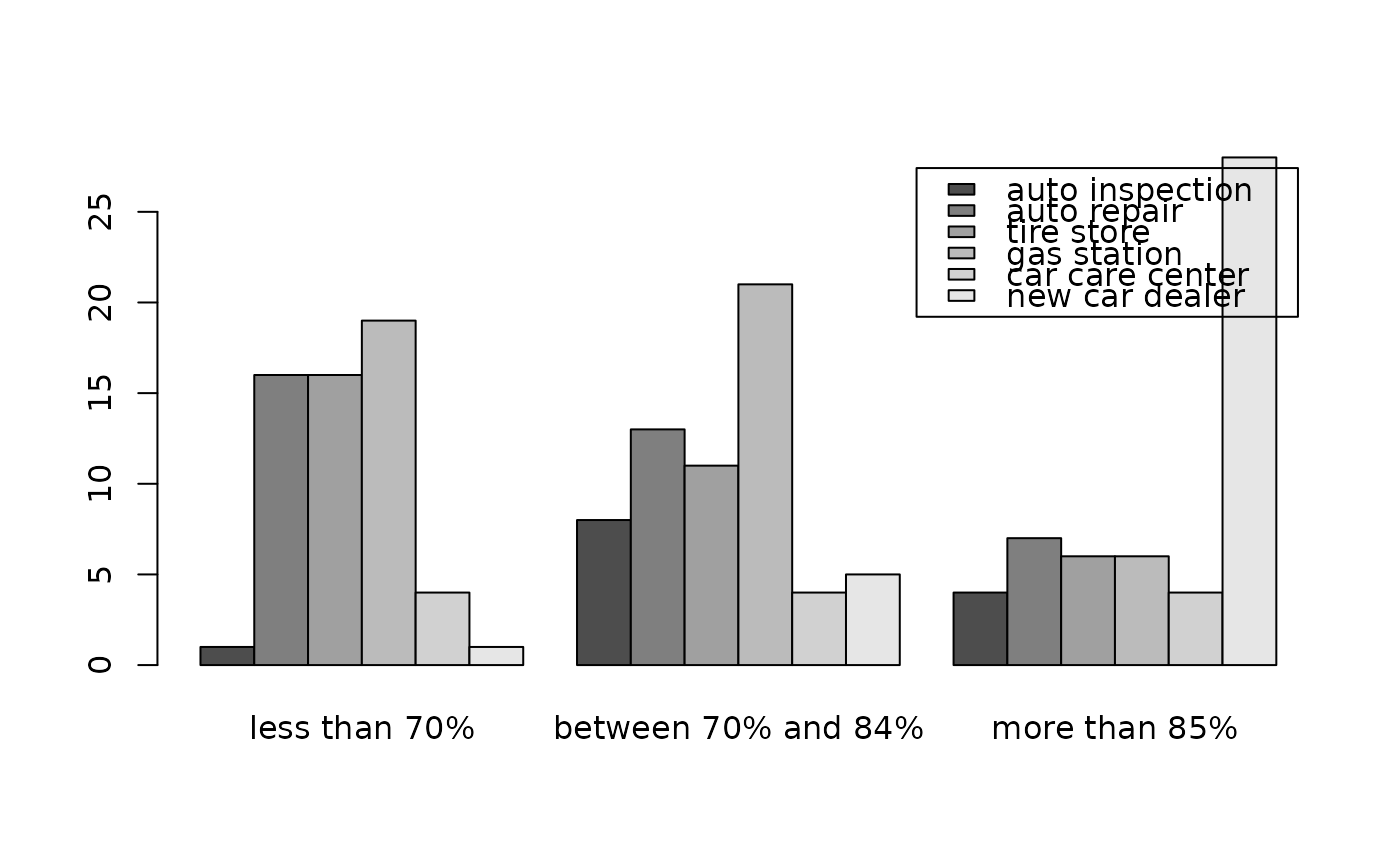
Percent of vehicles passing inspection by type inspection station
Source:R/BSDA-package.R
Inspect.RdData for Exercise 8.59
InspectFormat
A data frame/tibble with 174 observations on two variables
- station
a factor with levels
auto inspection,auto repair,car care center,gas station,new car dealer, andtire store- passed
a factor with levels
less than 70%,between 70% and 84%, andmore than 85%
Source
The Charlotte Observer, December 13, 1992.
References
Kitchens, L. J. (2003) Basic Statistics and Data Analysis. Pacific Grove, CA: Brooks/Cole, a division of Thomson Learning.
Examples
T1 <- xtabs(~ station + passed, data = Inspect)
T1
#>                  passed
#> station           less than 70% between 70% and 84% more than 85%
#>   auto inspection             1                   8             4
#>   auto repair                16                  13             7
#>   tire store                 16                  11             6
#>   gas station                19                  21             6
#>   car care center             4                   4             4
#>   new car dealer              1                   5            28
barplot(T1, beside = TRUE, legend = TRUE)

chisq.test(T1)
#> Warning: Chi-squared approximation may be incorrect
#>
#> 	Pearson's Chi-squared test
#>
#> data:  T1
#> X-squared = 61.027, df = 10, p-value = 2.316e-09
#>
rm(T1)

if (FALSE) {
library(ggplot2)
ggplot2::ggplot(data = Inspect, aes(x = passed, fill = station)) +
           geom_bar(position = "dodge") +
           theme_bw()
}
chisq.test(T1)
#> Warning: Chi-squared approximation may be incorrect
#>
#> Pearson's Chi-squared test
#>
#> data: T1
#> X-squared = 61.027, df = 10, p-value = 2.316e-09
#>
rm(T1)
if (FALSE) {
library(ggplot2)
ggplot2::ggplot(data = Inspect, aes(x = passed, fill = station)) +
geom_bar(position = "dodge") +
theme_bw()
}