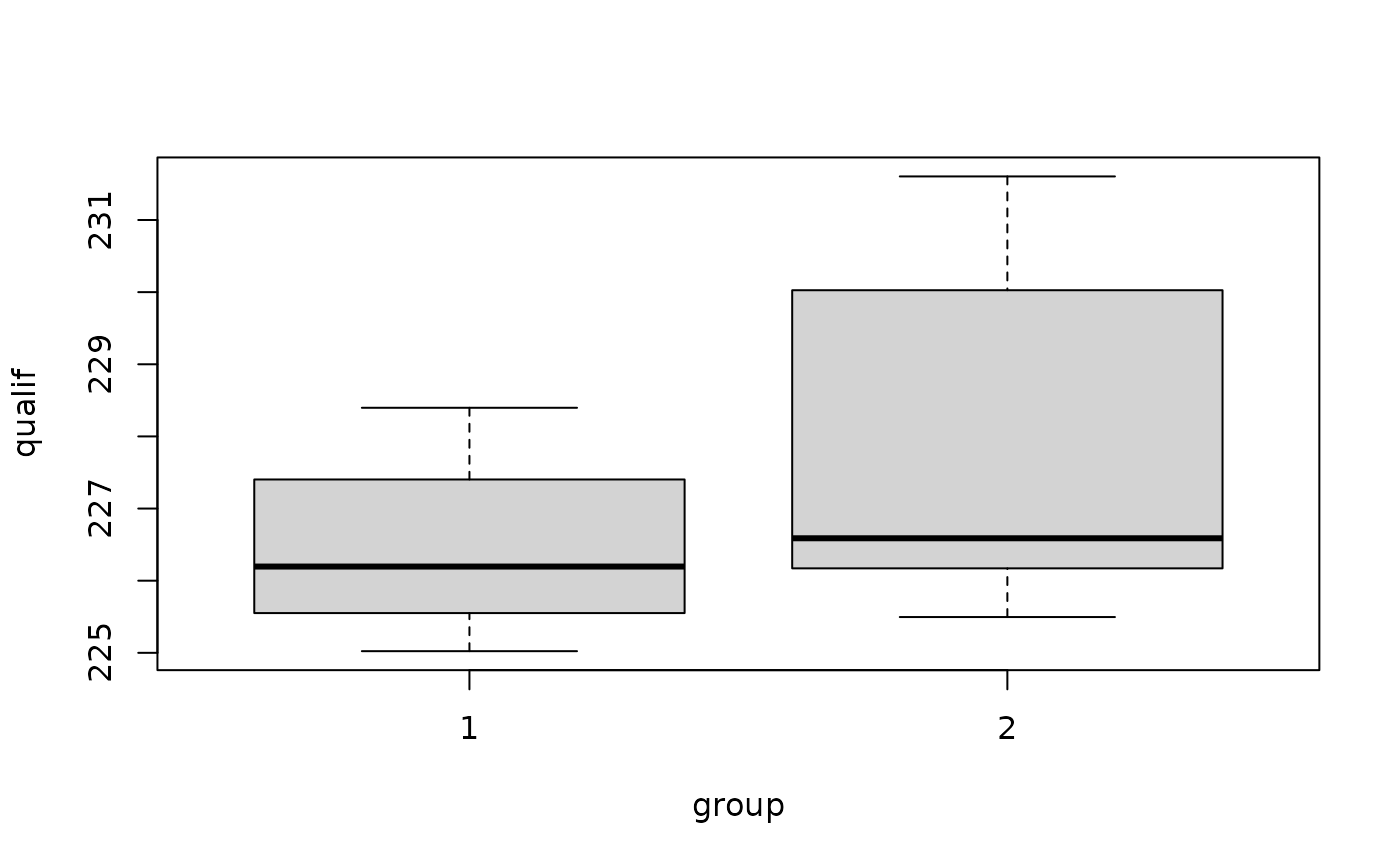
Qualifying miles per hour and number of previous starts for drivers in 79th Indianapolis 500 race
Source:R/BSDA-package.R
Indy500.RdData for Exercises 7.11 and 7.36
Indy500Format
A data frame/tibble with 33 observations on four variables
- driver
a character variable with values
andretti,bachelart,boesel,brayton,c.guerrero,cheever,fabi,fernandez,ferran,fittipaldi,fox,goodyear,gordon,gugelmin,herta,james,johansson,jones,lazier,luyendyk,matsuda,matsushita,pruett,r.guerrero,rahal,ribeiro,salazar,sharp,sullivan,tracy,vasser,villeneuve, andzampedri- qualif
qualifying speed (in mph)
- starts
number of Indianapolis 500 starts
- group
a numeric vector where 1 indicates the driver has 4 or fewer Indianapolis 500 starts and a 2 for drivers with 5 or more Indianapolis 500 starts
References
Kitchens, L. J. (2003) Basic Statistics and Data Analysis. Pacific Grove, CA: Brooks/Cole, a division of Thomson Learning.
Examples
stripchart(qualif ~ group, data = Indy500, method = "stack",
           pch = 19, col = c("red", "blue"))

boxplot(qualif ~ group, data = Indy500)

t.test(qualif ~ group, data = Indy500)
#>
#> 	Welch Two Sample t-test
#>
#> data:  qualif by group
#> t = -1.9197, df = 12.033, p-value = 0.07892
#> alternative hypothesis: true difference in means between group 1 and group 2 is not equal to 0
#> 95 percent confidence interval:
#>  -3.0111081  0.1899245
#> sample estimates:
#> mean in group 1 mean in group 2
#>        226.4538        227.8644
#>
if (FALSE) {
library(ggplot2)
ggplot2::ggplot(data = Indy500, aes(sample = qualif)) +
           geom_qq() +
           facet_grid(group ~ .) +
           theme_bw()
}
t.test(qualif ~ group, data = Indy500)
#>
#> Welch Two Sample t-test
#>
#> data: qualif by group
#> t = -1.9197, df = 12.033, p-value = 0.07892
#> alternative hypothesis: true difference in means between group 1 and group 2 is not equal to 0
#> 95 percent confidence interval:
#> -3.0111081 0.1899245
#> sample estimates:
#> mean in group 1 mean in group 2
#> 226.4538 227.8644
#>
if (FALSE) {
library(ggplot2)
ggplot2::ggplot(data = Indy500, aes(sample = qualif)) +
geom_qq() +
facet_grid(group ~ .) +
theme_bw()
}