Number of storms, hurricanes and El Nino effects from 1950 through 1995
Source:R/BSDA-package.R
Hurrican.RdData for Exercises 1.38, 10.19, and Example 1.6
HurricanFormat
A data frame/tibble with 46 observations on four variables
- year
a numeric vector indicating year
- storms
a numeric vector recording number of storms
- hurrican
a numeric vector recording number of hurricanes
- elnino
a factor with levels
cold,neutral, andwarm
Source
National Hurricane Center.
References
Kitchens, L. J. (2003) Basic Statistics and Data Analysis. Pacific Grove, CA: Brooks/Cole, a division of Thomson Learning.
Examples
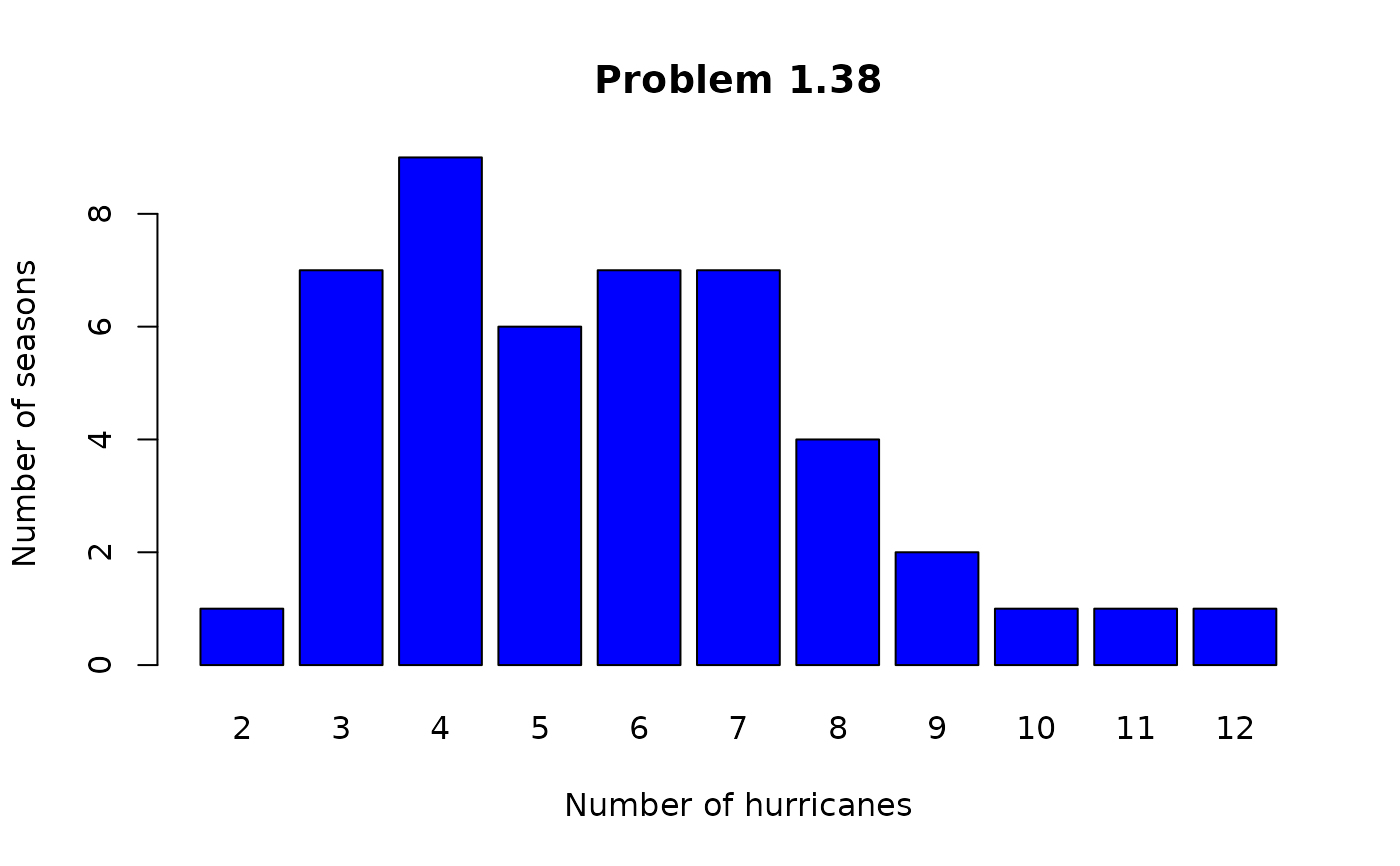
T1 <- xtabs(~hurrican, data = Hurrican)
T1
#> hurrican
#> 2 3 4 5 6 7 8 9 10 11 12
#> 1 7 9 6 7 7 4 2 1 1 1
barplot(T1, col = "blue", main = "Problem 1.38",
xlab = "Number of hurricanes",
ylab = "Number of seasons")
 boxplot(storms ~ elnino, data = Hurrican,
col = c("blue", "yellow", "red"))
boxplot(storms ~ elnino, data = Hurrican,
col = c("blue", "yellow", "red"))
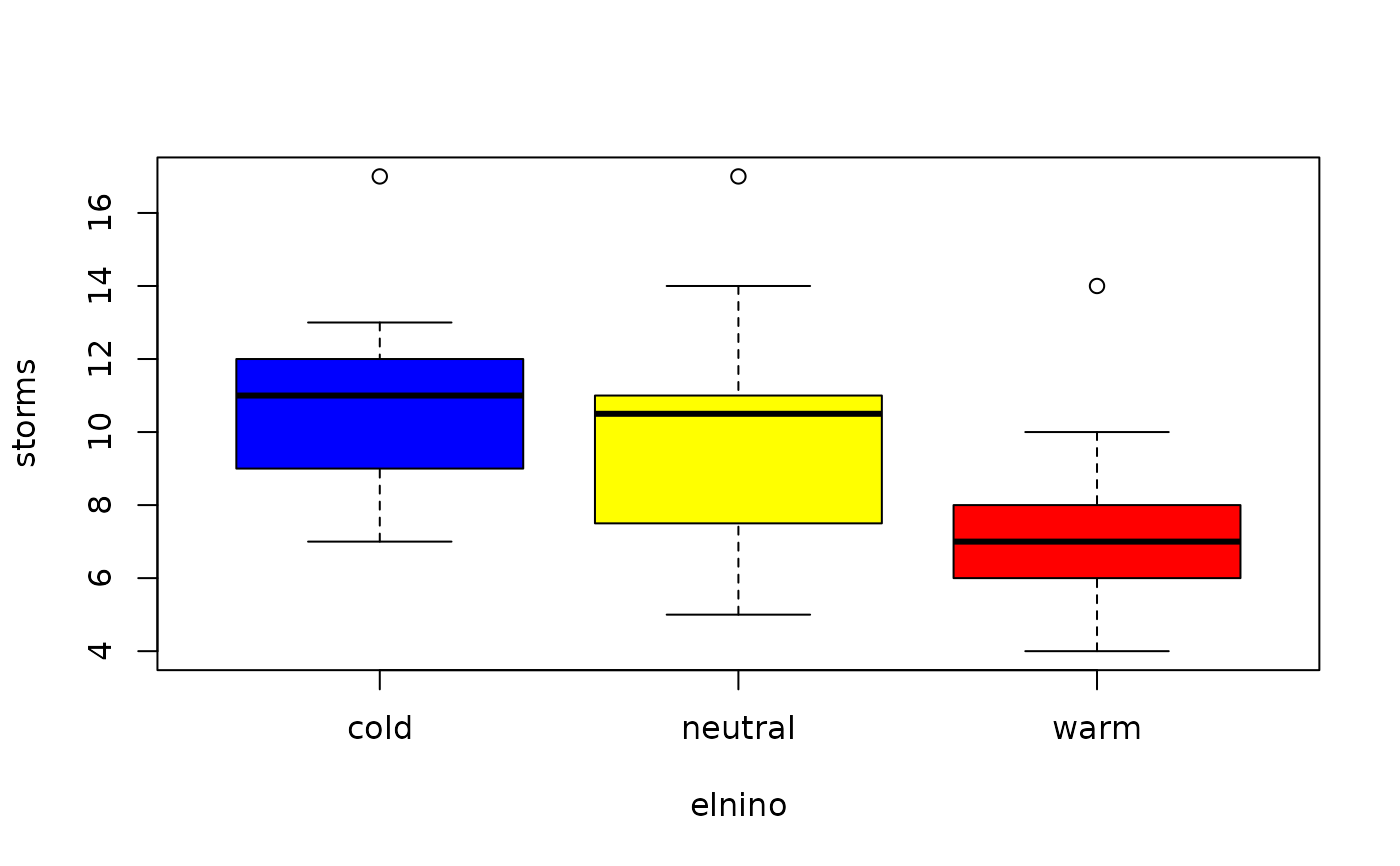 anova(lm(storms ~ elnino, data = Hurrican))
#> Analysis of Variance Table
#>
#> Response: storms
#> Df Sum Sq Mean Sq F value Pr(>F)
#> elnino 2 113.7 56.852 7.6299 0.001459 **
#> Residuals 43 320.4 7.451
#> ---
#> Signif. codes: 0 ‘***’ 0.001 ‘**’ 0.01 ‘*’ 0.05 ‘.’ 0.1 ‘ ’ 1
rm(T1)
anova(lm(storms ~ elnino, data = Hurrican))
#> Analysis of Variance Table
#>
#> Response: storms
#> Df Sum Sq Mean Sq F value Pr(>F)
#> elnino 2 113.7 56.852 7.6299 0.001459 **
#> Residuals 43 320.4 7.451
#> ---
#> Signif. codes: 0 ‘***’ 0.001 ‘**’ 0.01 ‘*’ 0.05 ‘.’ 0.1 ‘ ’ 1
rm(T1)