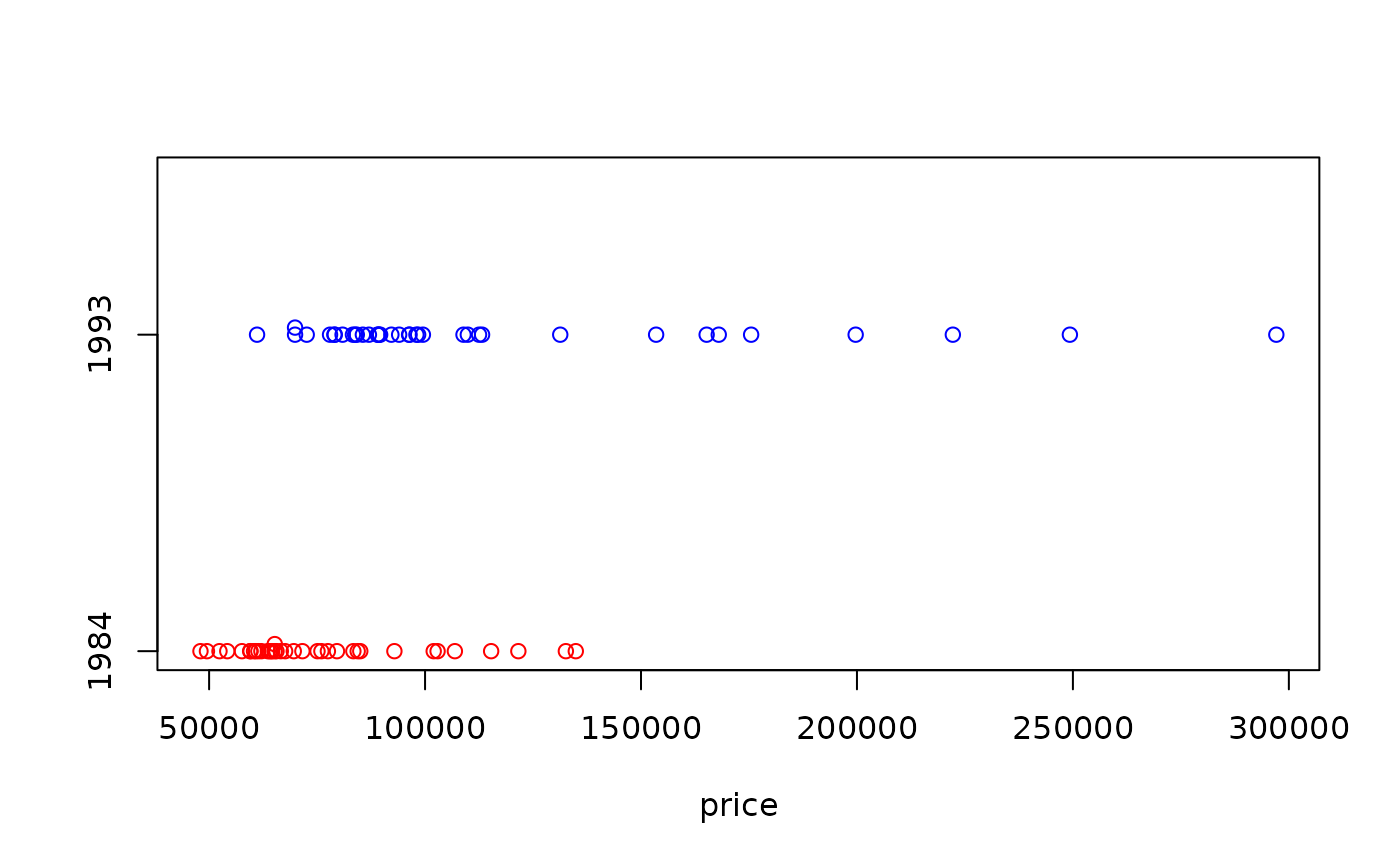
Median home prices for 1984 and 1993 in 37 markets across the U.S.
Source:R/BSDA-package.R
Housing.RdData for Exercise 5.82
HousingFormat
A data frame/tibble with 74 observations on three variables
- city
a character variable with values
Albany,Anaheim,Atlanta,Baltimore,Birmingham,Boston,Chicago,Cincinnati,Cleveland,Columbus,Dallas,Denver,Detroit,Ft Lauderdale,Houston,Indianapolis,Kansas City,Los Angeles,Louisville,Memphis,Miami,Milwaukee,Minneapolis,Nashville,New York,Oklahoma City,Philadelphia,Providence,Rochester,Salt Lake City,San Antonio,San Diego,San Francisco,San Jose,St Louis,Tampa, andWashington- year
a factor with levels
1984and1993- price
median house price (in dollars)
Source
National Association of Realtors.
References
Kitchens, L. J. (2003) Basic Statistics and Data Analysis. Pacific Grove, CA: Brooks/Cole, a division of Thomson Learning.
Examples
stripchart(price ~ year, data = Housing, method = "stack",
           pch = 1, col = c("red", "blue"))

if (FALSE) {
library(ggplot2)
ggplot2::ggplot(data = Housing, aes(x = price, fill = year)) +
           geom_dotplot() +
           facet_grid(year ~ .) +
           theme_bw()
}
if (FALSE) {
library(ggplot2)
ggplot2::ggplot(data = Housing, aes(x = price, fill = year)) +
geom_dotplot() +
facet_grid(year ~ .) +
theme_bw()
}