Hostility levels of high school students from rural, suburban, and urban areas
Source:R/BSDA-package.R
Hostile.RdData for Example 10.6
HostileFormat
A data frame/tibble with 135 observations on two variables
- location
a factor with the location of the high school student (
Rural,Suburban, orUrban)- hostility
the score from the Hostility Level Test
References
Kitchens, L. J. (2003) Basic Statistics and Data Analysis. Pacific Grove, CA: Brooks/Cole, a division of Thomson Learning.
Examples
boxplot(hostility ~ location, data = Hostile,
col = c("red", "blue", "green"))
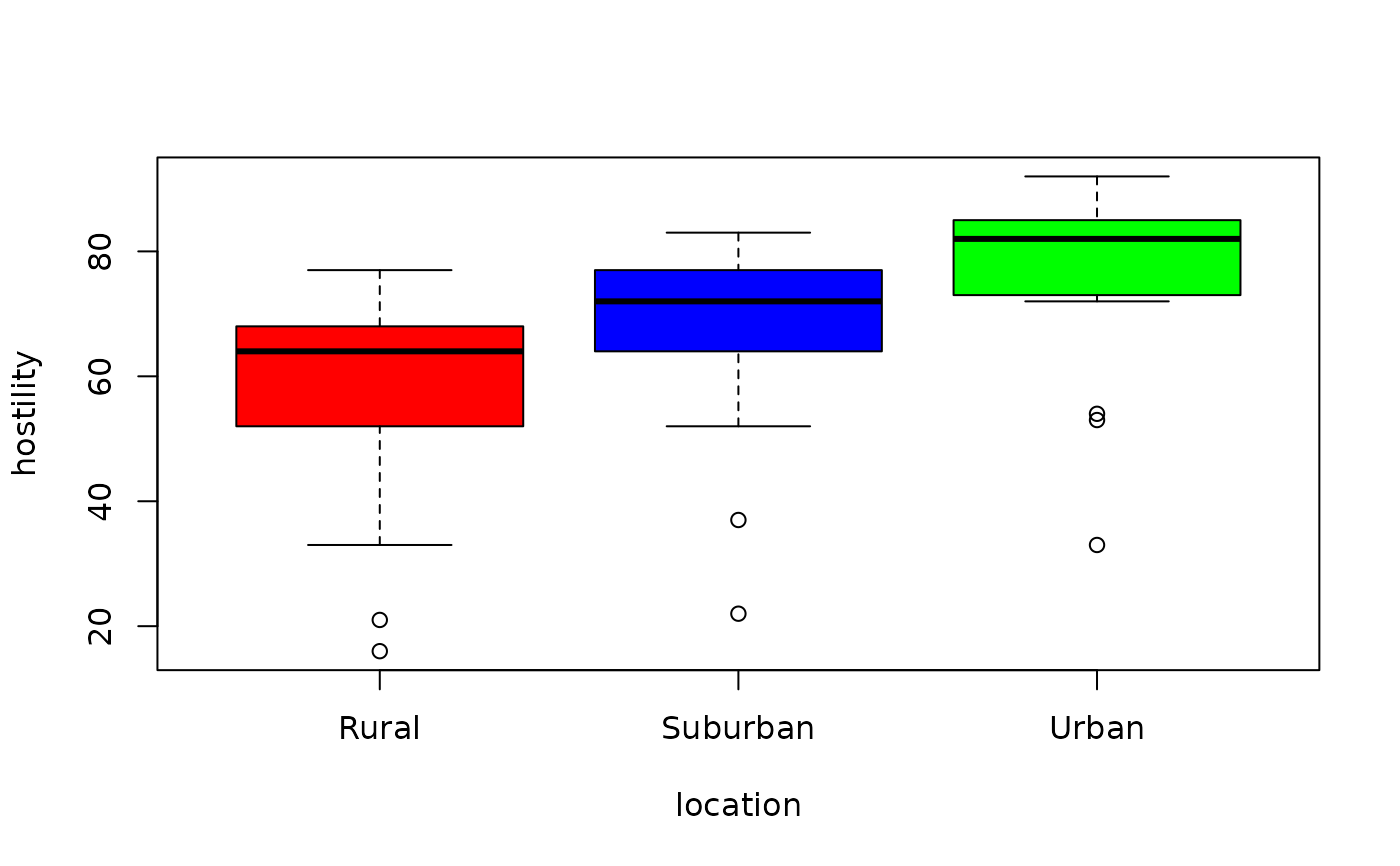 kruskal.test(hostility ~ location, data = Hostile)
#>
#> Kruskal-Wallis rank sum test
#>
#> data: hostility by location
#> Kruskal-Wallis chi-squared = 11.607, df = 2, p-value = 0.003018
#>
kruskal.test(hostility ~ location, data = Hostile)
#>
#> Kruskal-Wallis rank sum test
#>
#> data: hostility by location
#> Kruskal-Wallis chi-squared = 11.607, df = 2, p-value = 0.003018
#>