Data for Exercise 2.77
HodgkinFormat
A data frame/tibble with 538 observations on two variables
- type
a factor with levels
LD,LP,MC, andNS- response
a factor with levels
Positive,Partial, andNone
Source
I. Dunsmore, F. Daly, Statistical Methods, Unit 9, Categorical Data, Milton Keynes, The Open University, 18.
References
Kitchens, L. J. (2003) Basic Statistics and Data Analysis. Pacific Grove, CA: Brooks/Cole, a division of Thomson Learning.
Examples
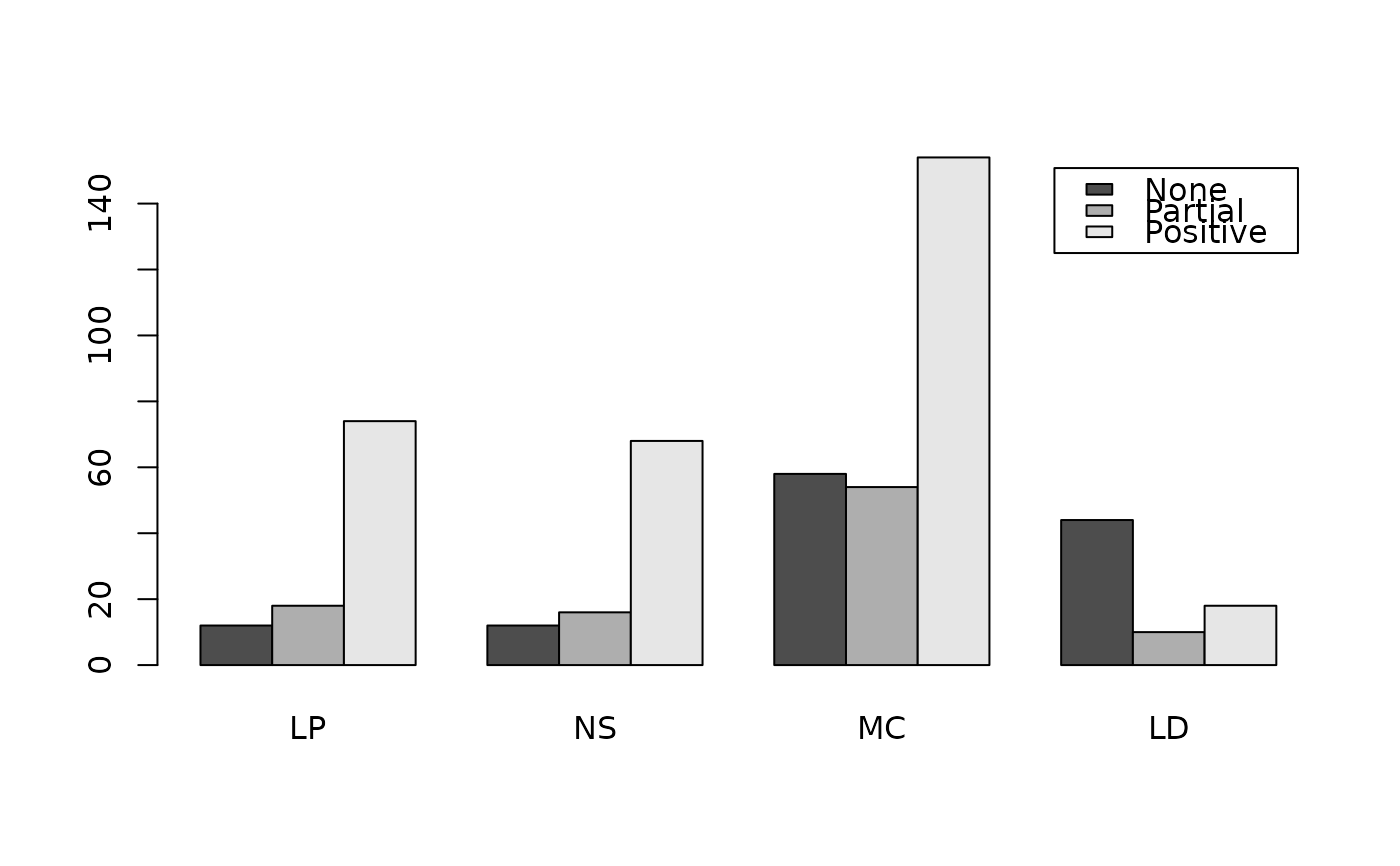
T1 <- xtabs(~type + response, data = Hodgkin)
T1
#>     response
#> type None Partial Positive
#>   LP   12      18       74
#>   NS   12      16       68
#>   MC   58      54      154
#>   LD   44      10       18
barplot(t(T1), legend = TRUE, beside = TRUE)


if (FALSE) {
library(ggplot2)
ggplot2::ggplot(data = Hodgkin, aes(x = type, fill = response)) +
           geom_bar(position = "dodge") +
           theme_bw()
}
if (FALSE) {
library(ggplot2)
ggplot2::ggplot(data = Hodgkin, aes(x = type, fill = response)) +
geom_bar(position = "dodge") +
theme_bw()
}