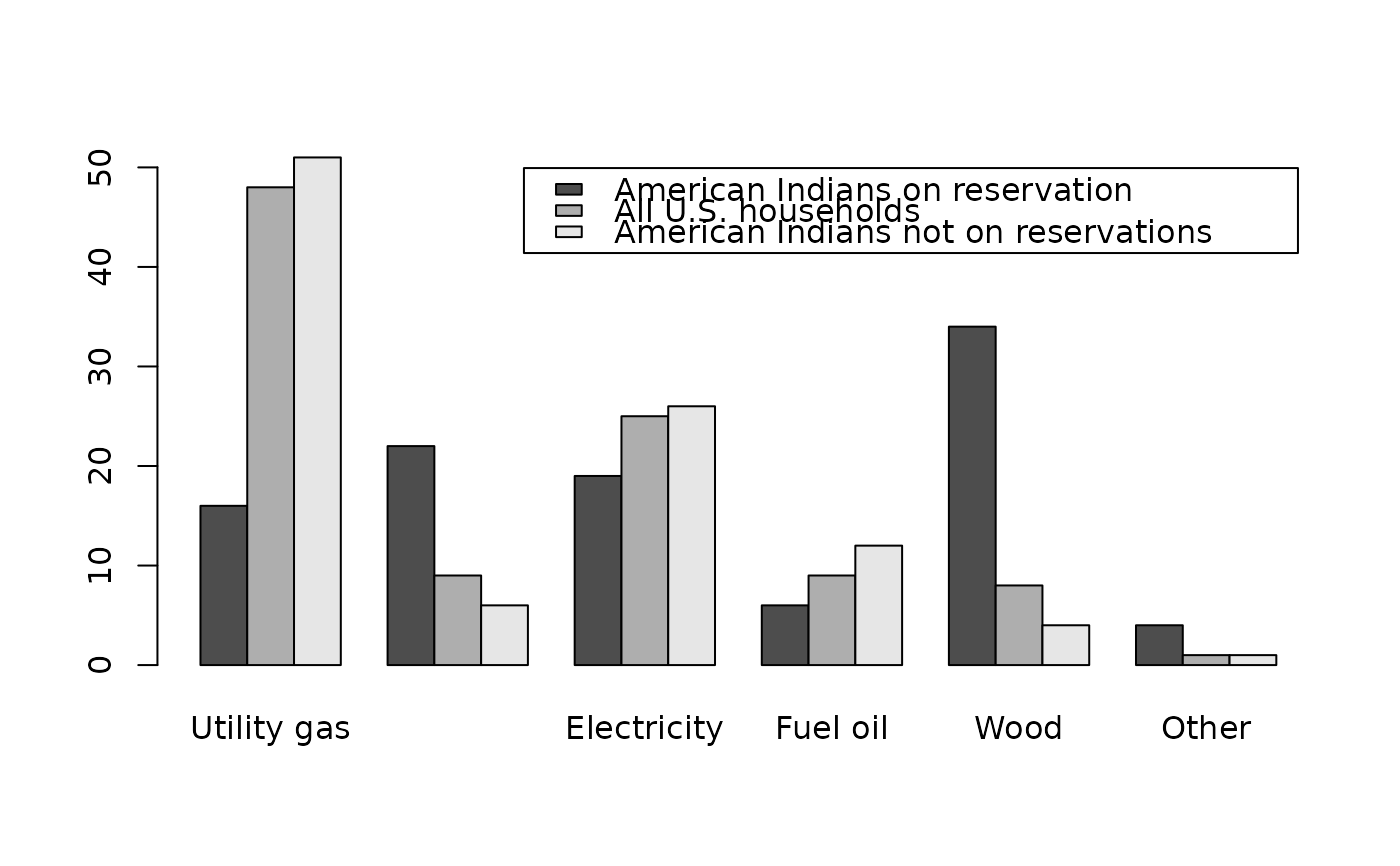
Primary heating sources of homes on indian reservations versus all households
Source:R/BSDA-package.R
Heat.RdData for Exercise 1.29
HeatFormat
A data frame/tibble with 301 observations on two variables
- fuel
a factor with levels
Utility gas,LP bottled gas,Electricity,Fuel oil,Wood, andOther- location
a factor with levels
American Indians on reservation,All U.S. households, andAmerican Indians not on reservations
Source
Bureau of the Census, Housing of the American Indians on Reservations, Statistical Brief 95-11, April 1995.
References
Kitchens, L. J. (2003) Basic Statistics and Data Analysis. Pacific Grove, CA: Brooks/Cole, a division of Thomson Learning.
Examples
T1 <- xtabs(~ fuel + location, data = Heat)
T1
#>                 location
#> fuel             American Indians on reservation All U.S. households
#>   Utility gas                                 16                  48
#>   LP bottled gas                              22                   9
#>   Electricity                                 19                  25
#>   Fuel oil                                     6                   9
#>   Wood                                        34                   8
#>   Other                                        4                   1
#>                 location
#> fuel             American Indians not on reservations
#>   Utility gas                                      51
#>   LP bottled gas                                    6
#>   Electricity                                      26
#>   Fuel oil                                         12
#>   Wood                                              4
#>   Other                                             1
barplot(t(T1), beside = TRUE, legend = TRUE)


if (FALSE) {
library(ggplot2)
ggplot2::ggplot(data = Heat, aes(x = fuel, fill = location)) +
           geom_bar(position = "dodge") +
           labs(y = "percent") +
           theme_bw() +
           theme(axis.text.x = element_text(angle = 30, hjust = 1))
}