Data for Exercise 10.4
GroupsFormat
A data frame/tibble with 78 observations on two variables
- group
a factor with levels
A,B, andC- response
a numeric vector
References
Kitchens, L. J. (2003) Basic Statistics and Data Analysis. Pacific Grove, CA: Brooks/Cole, a division of Thomson Learning.
Examples
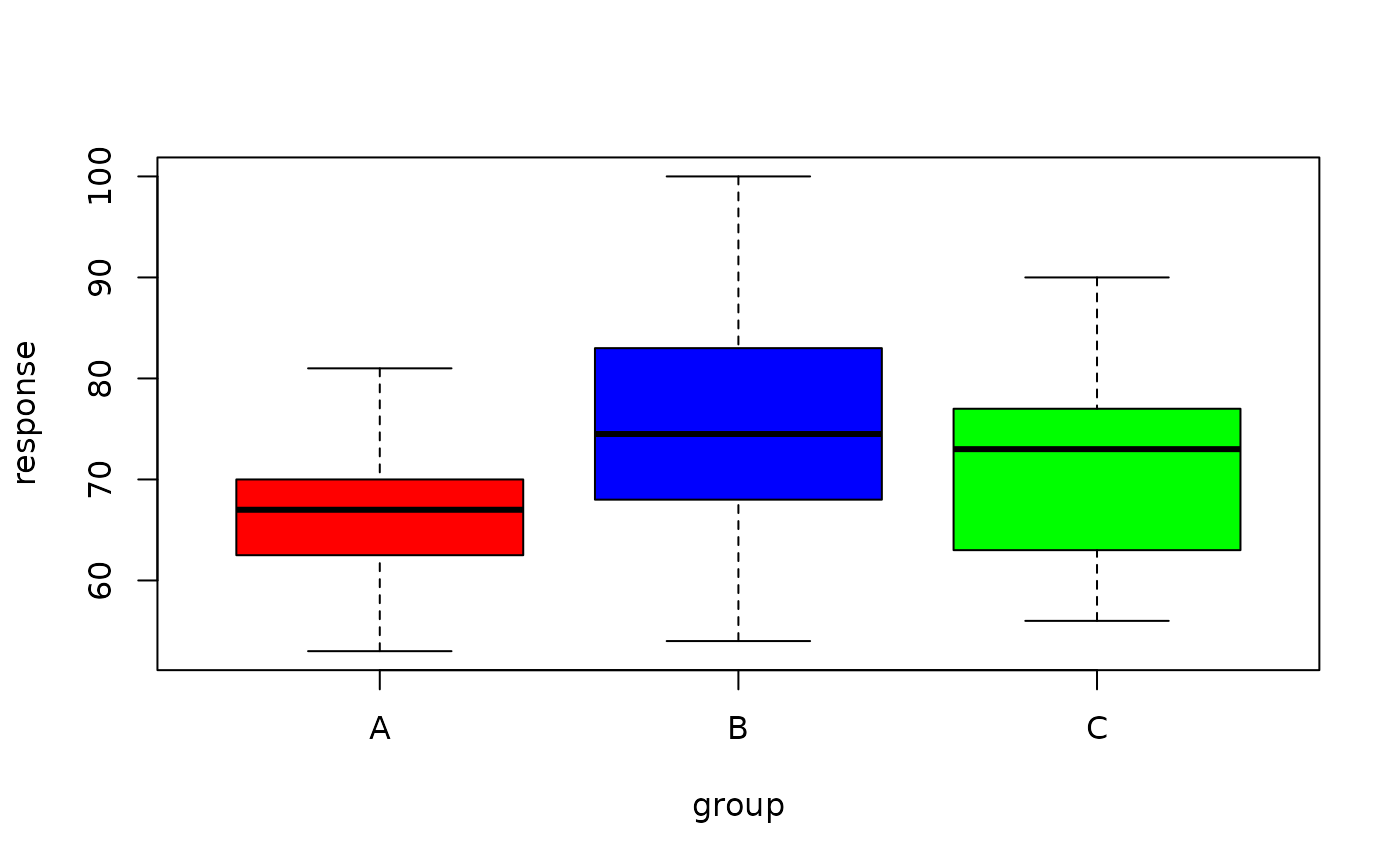
boxplot(response ~ group, data = Groups, col = c("red", "blue", "green"))

anova(lm(response ~ group, data = Groups))
#> Analysis of Variance Table
#>
#> Response: response
#>           Df Sum Sq Mean Sq F value   Pr(>F)
#> group      2 1067.5  533.75  6.0532 0.003738 **
#> Residuals 71 6260.5   88.18
#> ---
#> Signif. codes:  0 ‘***’ 0.001 ‘**’ 0.01 ‘*’ 0.05 ‘.’ 0.1 ‘ ’ 1
anova(lm(response ~ group, data = Groups))
#> Analysis of Variance Table
#>
#> Response: response
#> Df Sum Sq Mean Sq F value Pr(>F)
#> group 2 1067.5 533.75 6.0532 0.003738 **
#> Residuals 71 6260.5 88.18
#> ---
#> Signif. codes: 0 ‘***’ 0.001 ‘**’ 0.01 ‘*’ 0.05 ‘.’ 0.1 ‘ ’ 1