Data for Exercise 10.42

Groupabc

Format

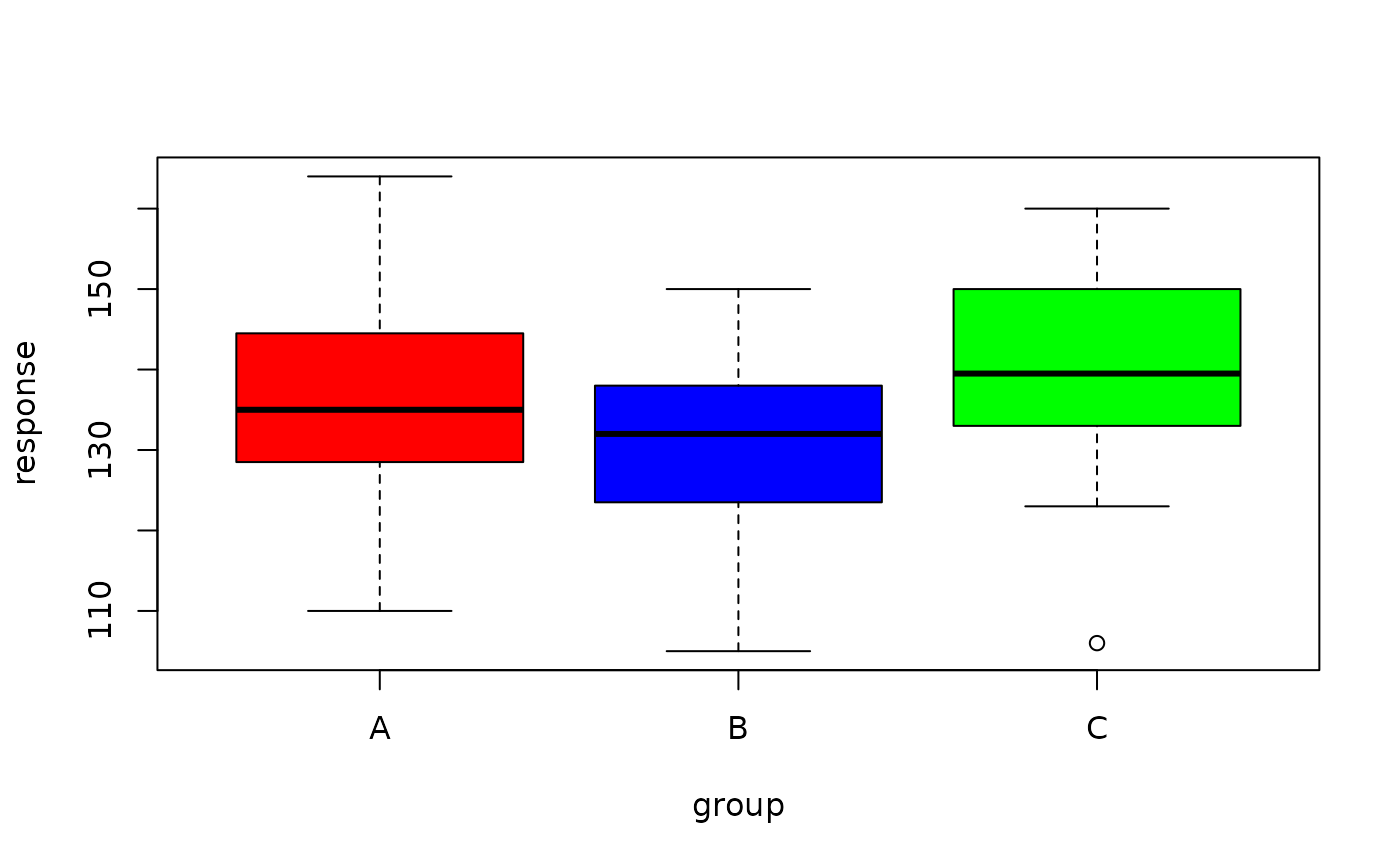
A data frame/tibble with 45 observations on two variables

group

a factor with levels A, B, and C

response

a numeric vector

References

Kitchens, L. J. (2003) Basic Statistics and Data Analysis. Pacific Grove, CA: Brooks/Cole, a division of Thomson Learning.

Examples


boxplot(response ~ group, data = Groupabc, 
        col = c("red", "blue", "green"))

        anova(lm(response ~ group, data = Groupabc))
#> Analysis of Variance Table
#> 
#> Response: response
#>           Df Sum Sq Mean Sq F value Pr(>F)
#> group      2  572.8  286.42  1.6106 0.2121
#> Residuals 41 7291.0  177.83