Data for Exercise 1.120
GradesFormat
A data frame with 29 observations on one variable
- grades
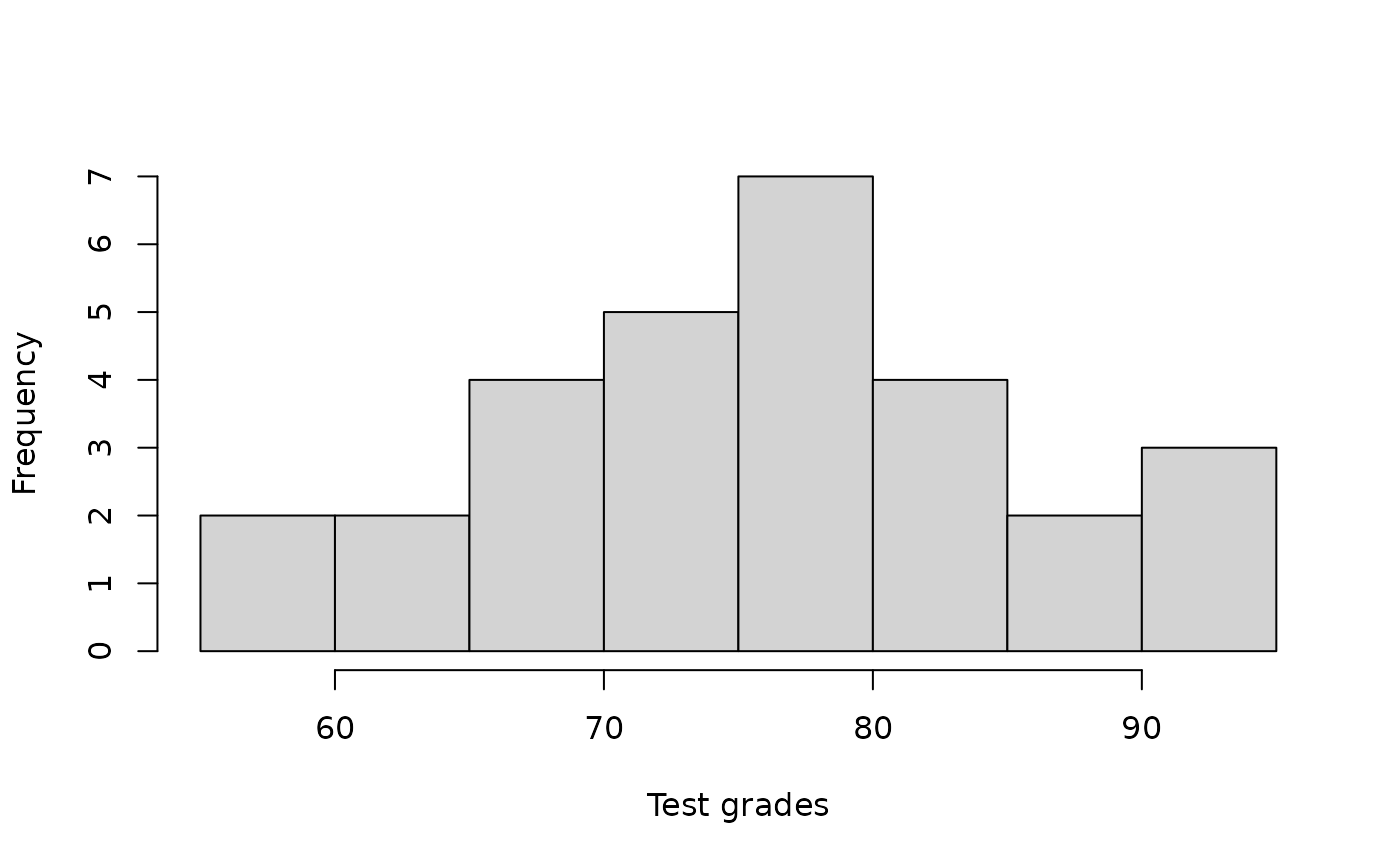
a numeric vector containing test grades
References
Kitchens, L. J. (2003) Basic Statistics and Data Analysis. Pacific Grove, CA: Brooks/Cole, a division of Thomson Learning.
Examples
hist(Grades$grades, main = "", xlab = "Test grades", right = FALSE)


if (FALSE) {
library(ggplot2)
ggplot2::ggplot(data = Grades, aes(x = grades, y = ..density..)) +
           geom_histogram(fill = "pink", binwidth = 5, color = "black") +
           geom_density(lwd = 2, color = "red") +
           theme_bw()
}
if (FALSE) {
library(ggplot2)
ggplot2::ggplot(data = Grades, aes(x = grades, y = ..density..)) +
geom_histogram(fill = "pink", binwidth = 5, color = "black") +
geom_density(lwd = 2, color = "red") +
theme_bw()
}