Data for Exercise 5.112
GovernorFormat
A data frame/tibble with 50 observations on three variables
- state
a character variable with values
Alabama,Alaska,Arizona,Arkansas,California,Colorado,Connecticut,Delaware,Florida,Georgia,Hawaii,Idaho,Illinois,Indiana,Iowa,Kansas,Kentucky,Louisiana,Maine,Maryland,Massachusetts,Michigan,Minnesota,Mississippi,Missouri,Montana,Nebraska,Nevada,New Hampshire,New Jersey,New Mexico,New York,North Carolina,North Dakota,Ohio,Oklahoma,Oregon,Pennsylvania,Rhode Island,South Carolina,South Dakota,Tennessee,Texas,Utah,Vermont,Virginia,Washington,West Virginia,Wisconsin, andWyoming- year
a factor indicating year
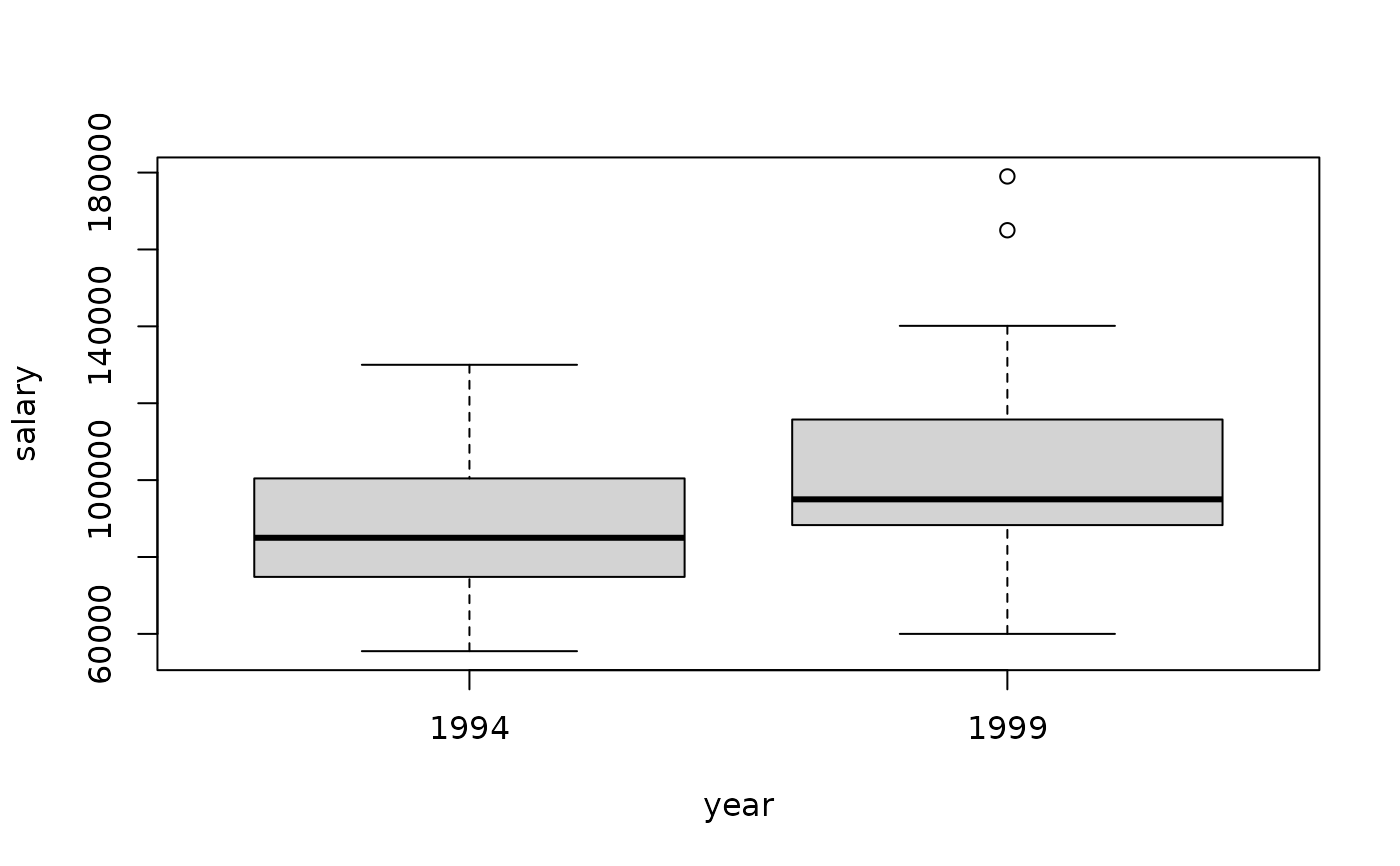
- salary
a numeric vector with the governor's salary (in dollars)
Source
The 2000 World Almanac and Book of Facts.
References
Kitchens, L. J. (2003) Basic Statistics and Data Analysis. Pacific Grove, CA: Brooks/Cole, a division of Thomson Learning.
Examples
boxplot(salary ~ year, data = Governor)


if (FALSE) {
library(ggplot2)
ggplot2::ggplot(data = Governor, aes(x = salary)) +
           geom_density(fill = "pink") +
           facet_grid(year ~ .) +
           theme_bw()
}
if (FALSE) {
library(ggplot2)
ggplot2::ggplot(data = Governor, aes(x = salary)) +
geom_density(fill = "pink") +
facet_grid(year ~ .) +
theme_bw()
}