Results of a Gallup poll on possession of marijuana as a criminal offense conducted in 1980
Source:R/BSDA-package.R
Gallup.RdData for Exercise 2.76
GallupFormat
A data frame/tibble with 1,200 observations on two variables
- demographics
a factor with levels
National,Gender: MaleGender: Female,Education: College,Eduction: High School,Education: Grade School,Age: 18-24,Age: 25-29,Age: 30-49,Age: 50-older,Religion: Protestant, andReligion: Catholic- opinion
a factor with levels
Criminal,Not Criminal, andNo Opinion
Source
George H. Gallup The Gallup Opinion Index Report No. 179 (Princeton, NJ: The Gallup Poll, July 1980), p. 15.
References
Kitchens, L. J. (2003) Basic Statistics and Data Analysis. Pacific Grove, CA: Brooks/Cole, a division of Thomson Learning.
Examples
T1 <- xtabs(~demographics + opinion, data = Gallup)
T1
#> opinion
#> demographics Criminal Not Criminal No Opinion
#> National 43 52 5
#> Gender: Male 42 53 5
#> Gender: Female 44 51 5
#> Education: College 30 67 3
#> Education: High School 45 50 5
#> Education: Grade School 58 33 9
#> Age: 18-24 27 67 6
#> Age: 25-29 26 70 4
#> Age: 30-49 45 52 3
#> Age: 50-older 54 39 7
#> Religion: Protestant 49 47 4
#> Religion: Catholic 39 55 6
t(T1[c(2, 3), ])
#> demographics
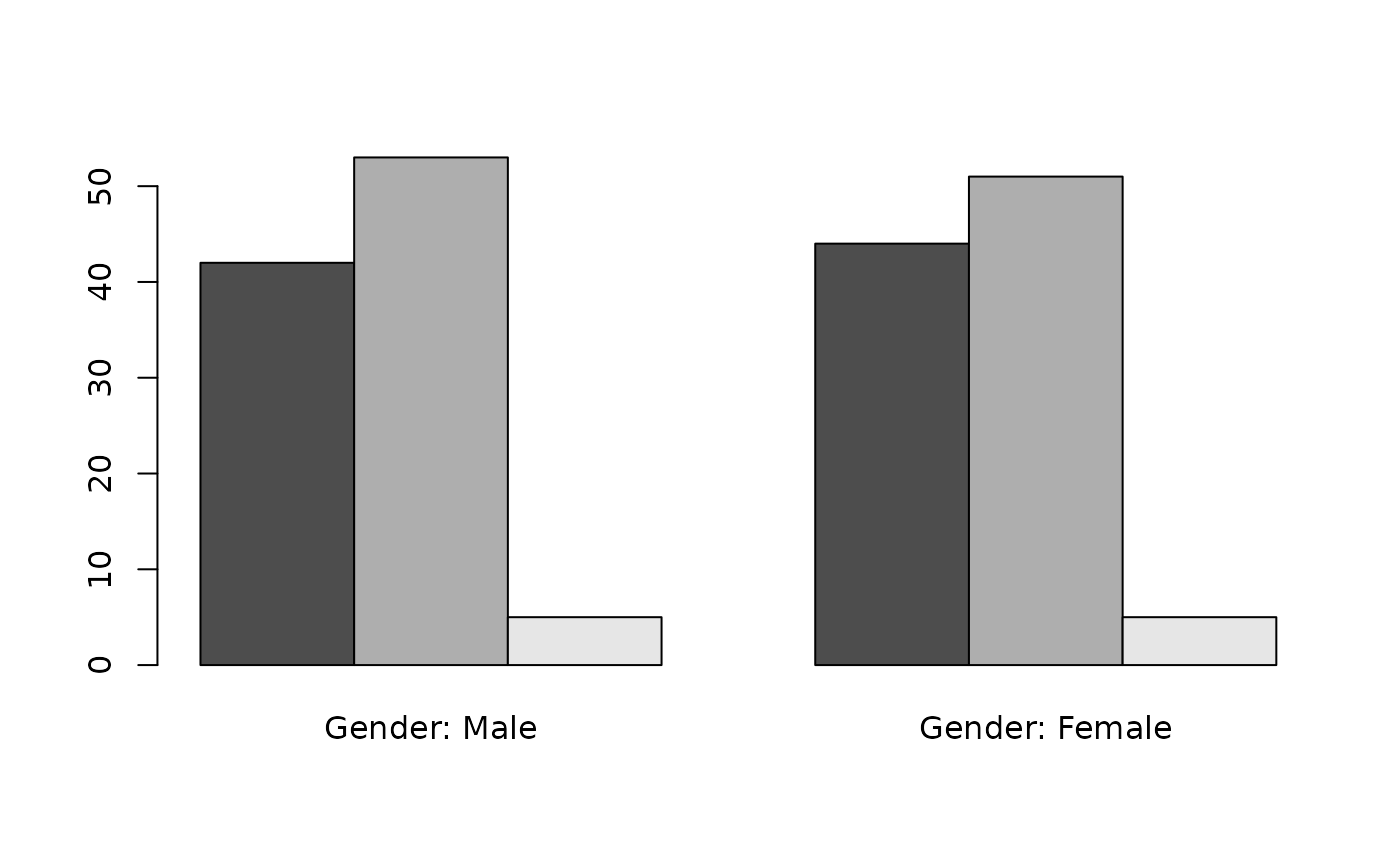
#> opinion Gender: Male Gender: Female
#> Criminal 42 44
#> Not Criminal 53 51
#> No Opinion 5 5
barplot(t(T1[c(2, 3), ]))
 barplot(t(T1[c(2, 3), ]), beside = TRUE)
 if (FALSE) {
library(dplyr)
library(ggplot2)
dplyr::filter(Gallup, demographics == "Gender: Male" | demographics == "Gender: Female") %>%
ggplot2::ggplot(aes(x = demographics, fill = opinion)) +
geom_bar() +
theme_bw() +
labs(y = "Fraction")
}
if (FALSE) {
library(dplyr)
library(ggplot2)
dplyr::filter(Gallup, demographics == "Gender: Male" | demographics == "Gender: Female") %>%
ggplot2::ggplot(aes(x = demographics, fill = opinion)) +
geom_bar() +
theme_bw() +
labs(y = "Fraction")
}