Cholesterol values of 62 subjects in the Framingham Heart Study
Source:R/BSDA-package.R
Framingh.RdData for Exercises 1.56, 1.75, 3.69, and 5.60
FraminghFormat
A data frame/tibble with 62 observations on one variable
- cholest
a numeric vector with cholesterol values
Source
R. D'Agostino, et al., (1990) "A Suggestion for Using Powerful and Informative Tests for Normality," The American Statistician, 44 316-321.
References
Kitchens, L. J. (2003) Basic Statistics and Data Analysis. Pacific Grove, CA: Brooks/Cole, a division of Thomson Learning.
Examples
stem(Framingh$cholest)
#>
#> The decimal point is 1 digit(s) to the right of the |
#>
#> 16 | 7
#> 18 | 428
#> 20 | 020125678
#> 22 | 05560000122244668
#> 24 | 03678444668
#> 26 | 34777800288
#> 28 | 35
#> 30 | 008
#> 32 | 746
#> 34 | 3
#> 36 |
#> 38 | 3
#>
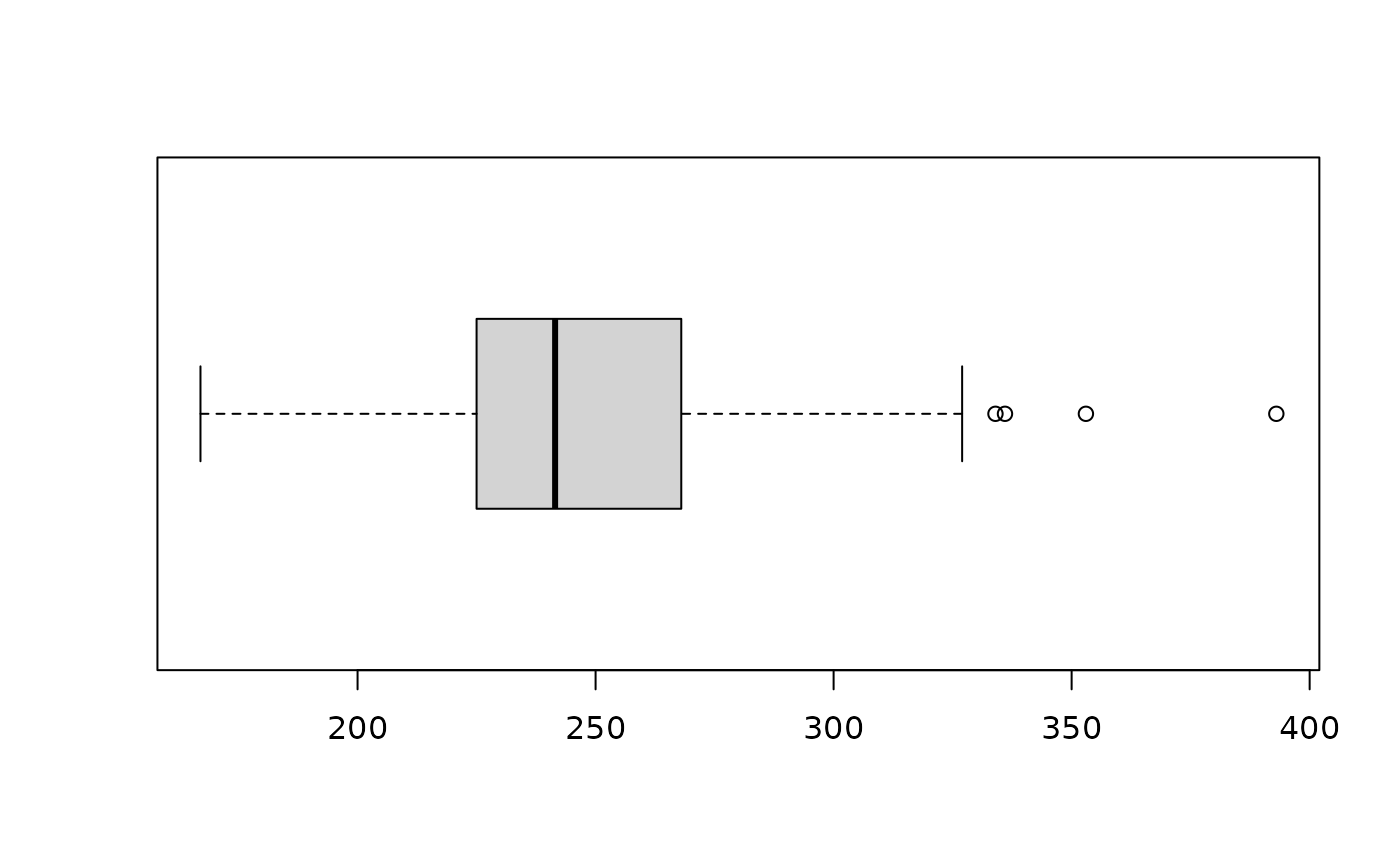
boxplot(Framingh$cholest, horizontal = TRUE)
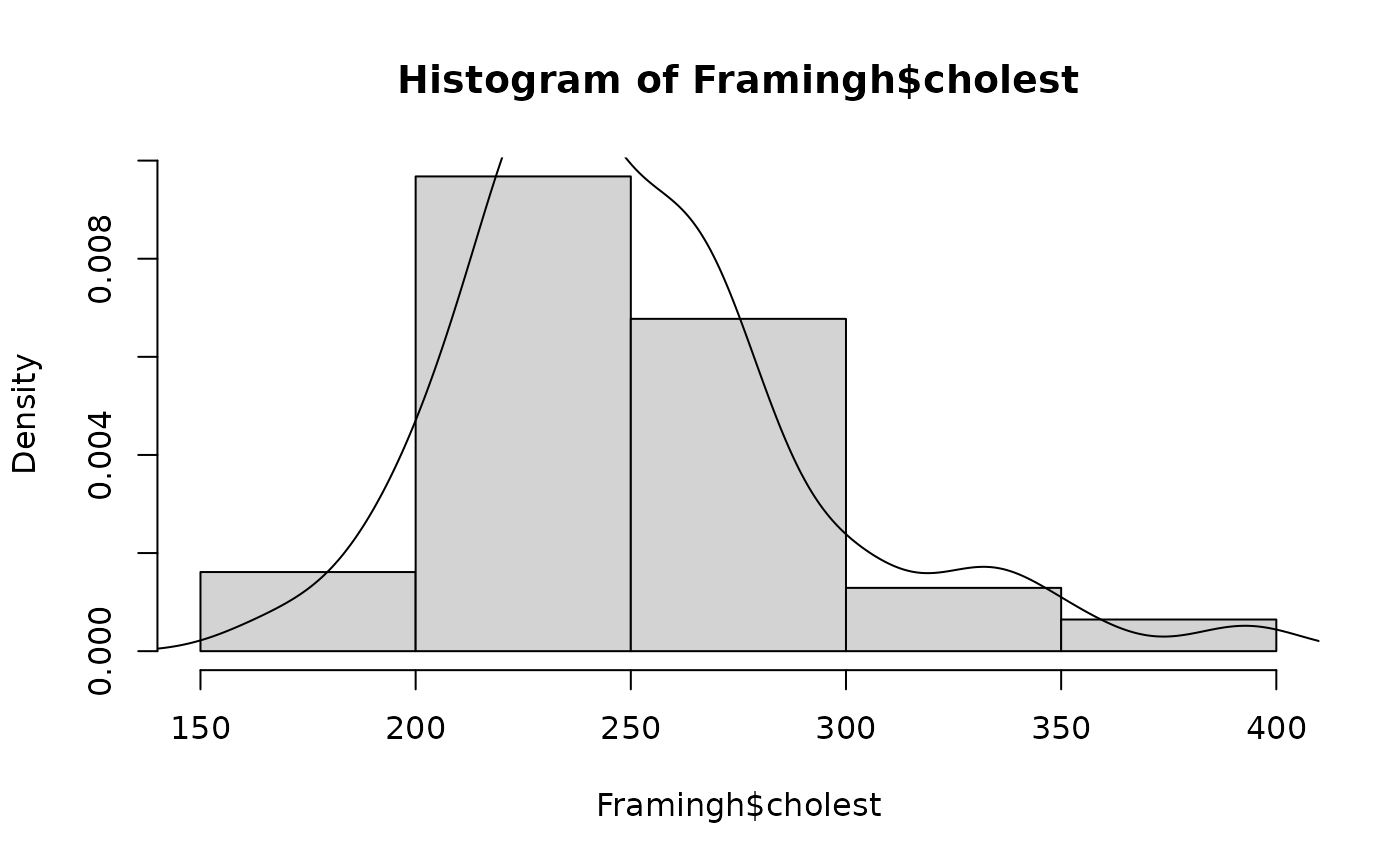
 hist(Framingh$cholest, freq = FALSE)
lines(density(Framingh$cholest))
hist(Framingh$cholest, freq = FALSE)
lines(density(Framingh$cholest))
 mean(Framingh$cholest > 200 & Framingh$cholest < 240)
#> [1] 0.4032258
if (FALSE) {
library(ggplot2)
ggplot2::ggplot(data = Framingh, aes(x = factor(1), y = cholest)) +
geom_boxplot() + # boxplot
labs(x = "") + # no x label
theme_bw() + # black and white theme
geom_jitter(width = 0.2) + # jitter points
coord_flip() # Create horizontal plot
ggplot2::ggplot(data = Framingh, aes(x = cholest, y = ..density..)) +
geom_histogram(fill = "pink", binwidth = 15, color = "black") +
geom_density() +
theme_bw()
}
mean(Framingh$cholest > 200 & Framingh$cholest < 240)
#> [1] 0.4032258
if (FALSE) {
library(ggplot2)
ggplot2::ggplot(data = Framingh, aes(x = factor(1), y = cholest)) +
geom_boxplot() + # boxplot
labs(x = "") + # no x label
theme_bw() + # black and white theme
geom_jitter(width = 0.2) + # jitter points
coord_flip() # Create horizontal plot
ggplot2::ggplot(data = Framingh, aes(x = cholest, y = ..density..)) +
geom_histogram(fill = "pink", binwidth = 15, color = "black") +
geom_density() +
theme_bw()
}