Data for Exercise 1.125
FertilityFormat
A data frame/tibble with 51 observations on two variables
- state
a character variable with values
Alabama,Alaska,Arizona,Arkansas,California,Colorado,Connecticut,Delaware,District of Colunbia,Florida,Georgia,Hawaii,Idaho,Illinois,Indiana,Iowa,Kansas,Kentucky,Louisiana,Maine,Maryland,Massachusetts,Michigan,Minnesota,Mississippi,Missour,Montana,Nebraska,Nevada,New Hampshire,New Jersey,New Mexico,New York,North Carolina,North Dakota,Ohio,Oklahoma,Oregon,Pennsylvania,Rhode Island,South Carolina,South Dakota,Tennessee,Texas,Utah,Vermont,Virginia,Washington,West Virginia,Wisconsin, andWyoming- rate
fertility rate (expected number of births during childbearing years)
Source
Population Reference Bureau.
References
Kitchens, L. J. (2003) Basic Statistics and Data Analysis. Pacific Grove, CA: Brooks/Cole, a division of Thomson Learning.
Examples
stem(Fertility$rate)
#>
#> The decimal point is 1 digit(s) to the left of the |
#>
#> 14 | 0000
#> 16 | 00000000000
#> 18 | 000000000000000000
#> 20 | 0000000000
#> 22 | 0000
#> 24 | 000
#> 26 |
#> 28 |
#> 30 |
#> 32 | 0
#>
fivenum(Fertility$rate)
#> [1] 1.50 1.70 1.90 2.05 3.20
EDA(Fertility$rate)
#> [1] "Fertility$rate"
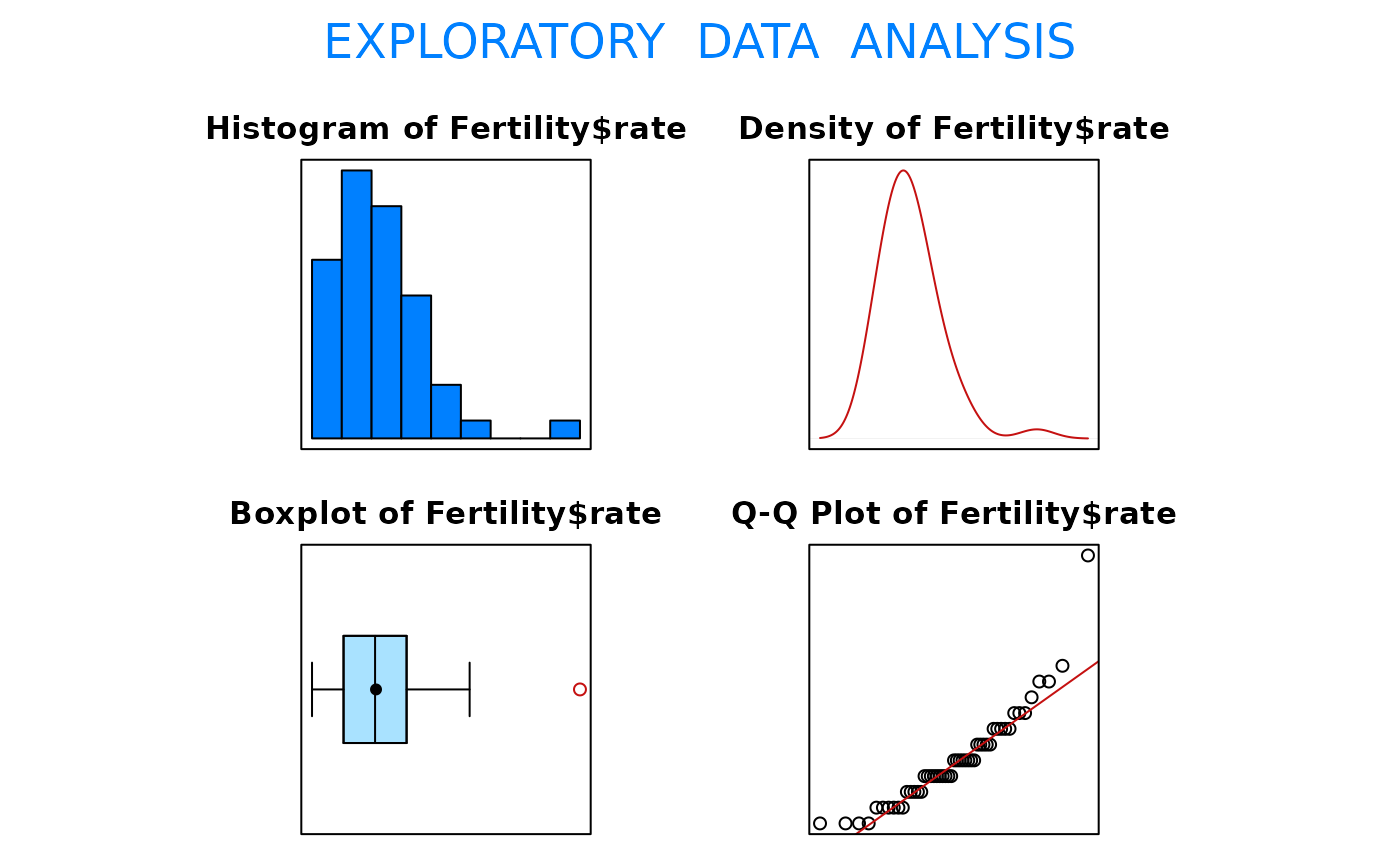 #> Size (n) Missing Minimum 1st Qu Mean Median TrMean 3rd Qu
#> 51.000 0.000 1.500 1.700 1.906 1.900 1.883 2.100
#> Max. Stdev. Var. SE Mean I.Q.R. Range Kurtosis Skewness
#> 3.200 0.307 0.094 0.043 0.400 1.700 4.240 1.562
#> SW p-val
#> 0.000
#> Size (n) Missing Minimum 1st Qu Mean Median TrMean 3rd Qu
#> 51.000 0.000 1.500 1.700 1.906 1.900 1.883 2.100
#> Max. Stdev. Var. SE Mean I.Q.R. Range Kurtosis Skewness
#> 3.200 0.307 0.094 0.043 0.400 1.700 4.240 1.562
#> SW p-val
#> 0.000