Waiting times between successive eruptions of the Old Faithful geyser
Source:R/BSDA-package.R
Faithful.RdData for Exercise 5.12 and 5.111
FaithfulFormat
A data frame/tibble with 299 observations on two variables
- time
a numeric vector
- eruption
a factor with levels
1and2
Source
A. Azzalini and A. Bowman, "A Look at Some Data on the Old Faithful Geyser," Journal of the Royal Statistical Society, Series C, 39 (1990), 357-366.
References
Kitchens, L. J. (2003) Basic Statistics and Data Analysis. Pacific Grove, CA: Brooks/Cole, a division of Thomson Learning.
Examples
t.test(time ~ eruption, data = Faithful)
#>
#> Welch Two Sample t-test
#>
#> data: time by eruption
#> t = -25.56, df = 208.34, p-value < 2.2e-16
#> alternative hypothesis: true difference in means between group 1 and group 2 is not equal to 0
#> 95 percent confidence interval:
#> -25.91029 -22.19957
#> sample estimates:
#> mean in group 1 mean in group 2
#> 57.10909 81.16402
#>
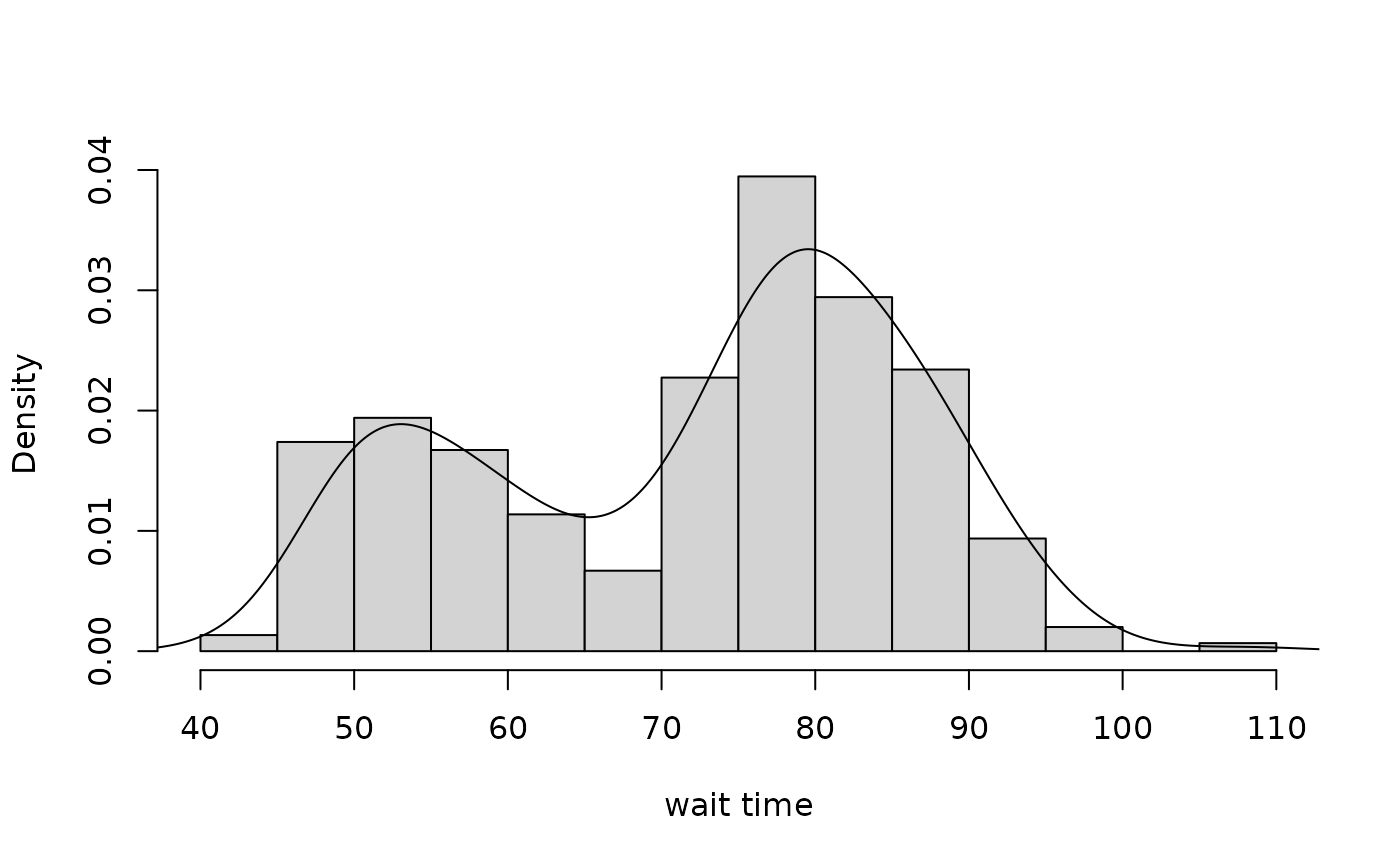
hist(Faithful$time, xlab = "wait time", main = "", freq = FALSE)
lines(density(Faithful$time))
 if (FALSE) {
library(ggplot2)
ggplot2::ggplot(data = Faithful, aes(x = time, y = ..density..)) +
geom_histogram(binwidth = 5, fill = "pink", col = "black") +
geom_density() +
theme_bw() +
labs(x = "wait time")
}
if (FALSE) {
library(ggplot2)
ggplot2::ggplot(data = Faithful, aes(x = time, y = ..density..)) +
geom_histogram(binwidth = 5, fill = "pink", col = "black") +
geom_density() +
theme_bw() +
labs(x = "wait time")
}