Data for Exercise 1.92 and 2.61
ElderlyFormat
A data frame/tibble with 51 observations on three variables
- state
a factor with levels
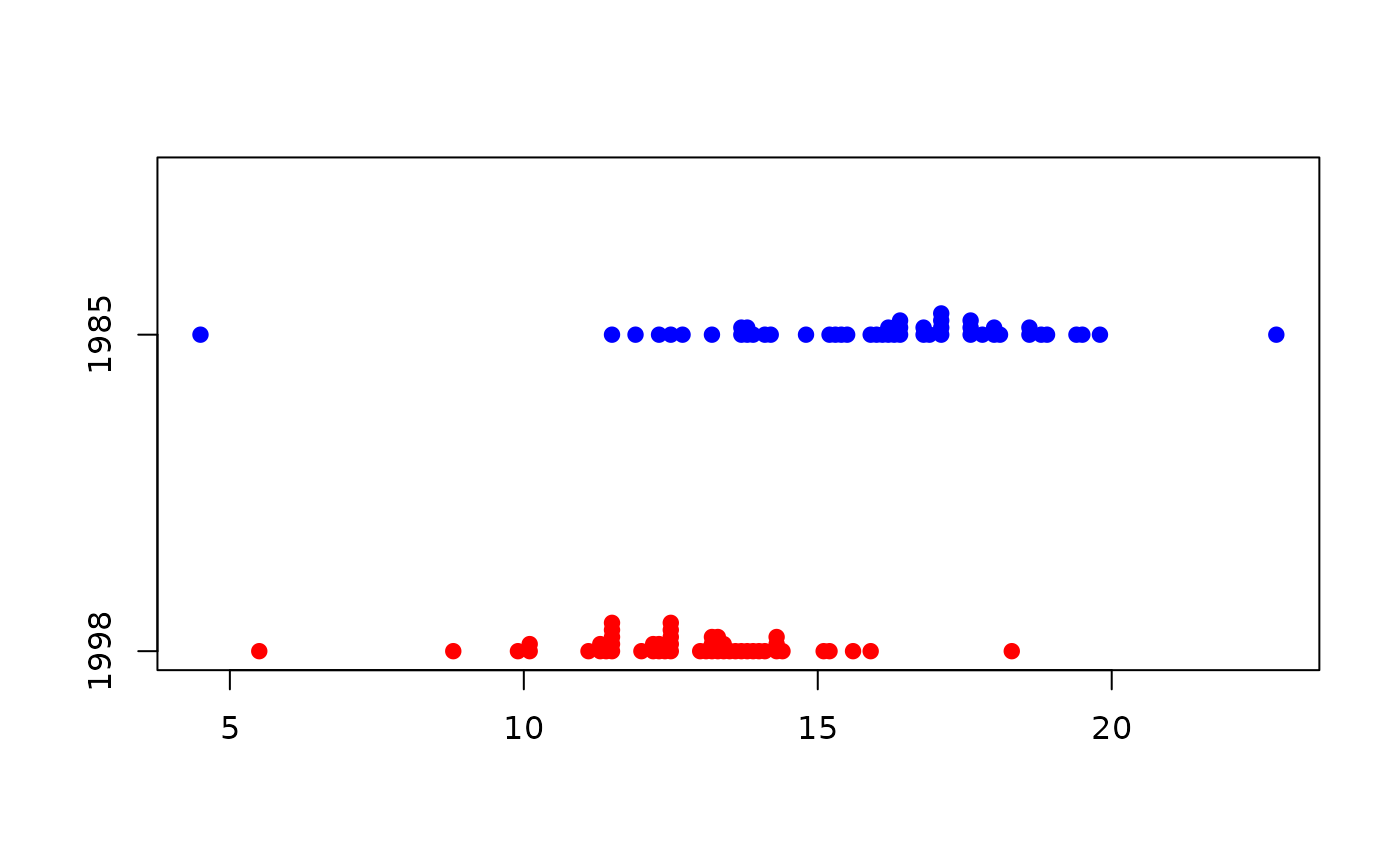
Alabama,Alaska,Arizona,Arkansas,California,Colorado,Connecticut,Delaware,District of Colunbia,Florida,Georgia,Hawaii,Idaho,Illinois,Indiana,Iowa,Kansas,Kentucky,Louisiana,Maine,Maryland,Massachusetts,Michigan,Minnesota,Mississippi,Missour,Montana,Nebraska,Nevada,New Hampshire,New Jersey,New Mexico,New York,North Carolina,North Dakota,Ohio,Oklahoma,Oregon,Pennsylvania,Rhode Island,South Carolina,South Dakota,Tennessee,Texas,Utah,Vermont,Virginia,Washington,West Virginia,Wisconsin, andWyoming- percent1985
percent of the population over the age of 65 in 1985
- percent1998
percent of the population over the age of 65 in 1998
Source
U.S. Census Bureau Internet site, February 2000.
References
Kitchens, L. J. (2003) Basic Statistics and Data Analysis. Pacific Grove, CA: Brooks/Cole, a division of Thomson Learning.
Examples
with(data = Elderly,
stripchart(x = list(percent1998, percent1985), method = "stack", pch = 19,
           col = c("red","blue"), group.names = c("1998", "1985"))
           )

with(data = Elderly, cor(percent1998, percent1985))
#> [1] 0.8919852
if (FALSE) {
library(ggplot2)
ggplot2::ggplot(data = Elderly, aes(x = percent1985, y = percent1998)) +
           geom_point() +
           theme_bw()
}
with(data = Elderly, cor(percent1998, percent1985))
#> [1] 0.8919852
if (FALSE) {
library(ggplot2)
ggplot2::ggplot(data = Elderly, aes(x = percent1985, y = percent1998)) +
geom_point() +
theme_bw()
}