One hundred year record of worldwide seismic activity(1770-1869)
Source:R/BSDA-package.R
Earthqk.RdData for Exercise 6.97
EarthqkFormat
A data frame/tibble with 100 observations on two variables
- year
year seimic activity recorded
- severity
annual incidence of sever earthquakes
Source
Quenoille, M.H. (1952), Associated Measurements, Butterworth, London. p 279.
References
Kitchens, L. J. (2003) Basic Statistics and Data Analysis. Pacific Grove, CA: Brooks/Cole, a division of Thomson Learning.
Examples
EDA(Earthqk$severity)
#> [1] "Earthqk$severity"
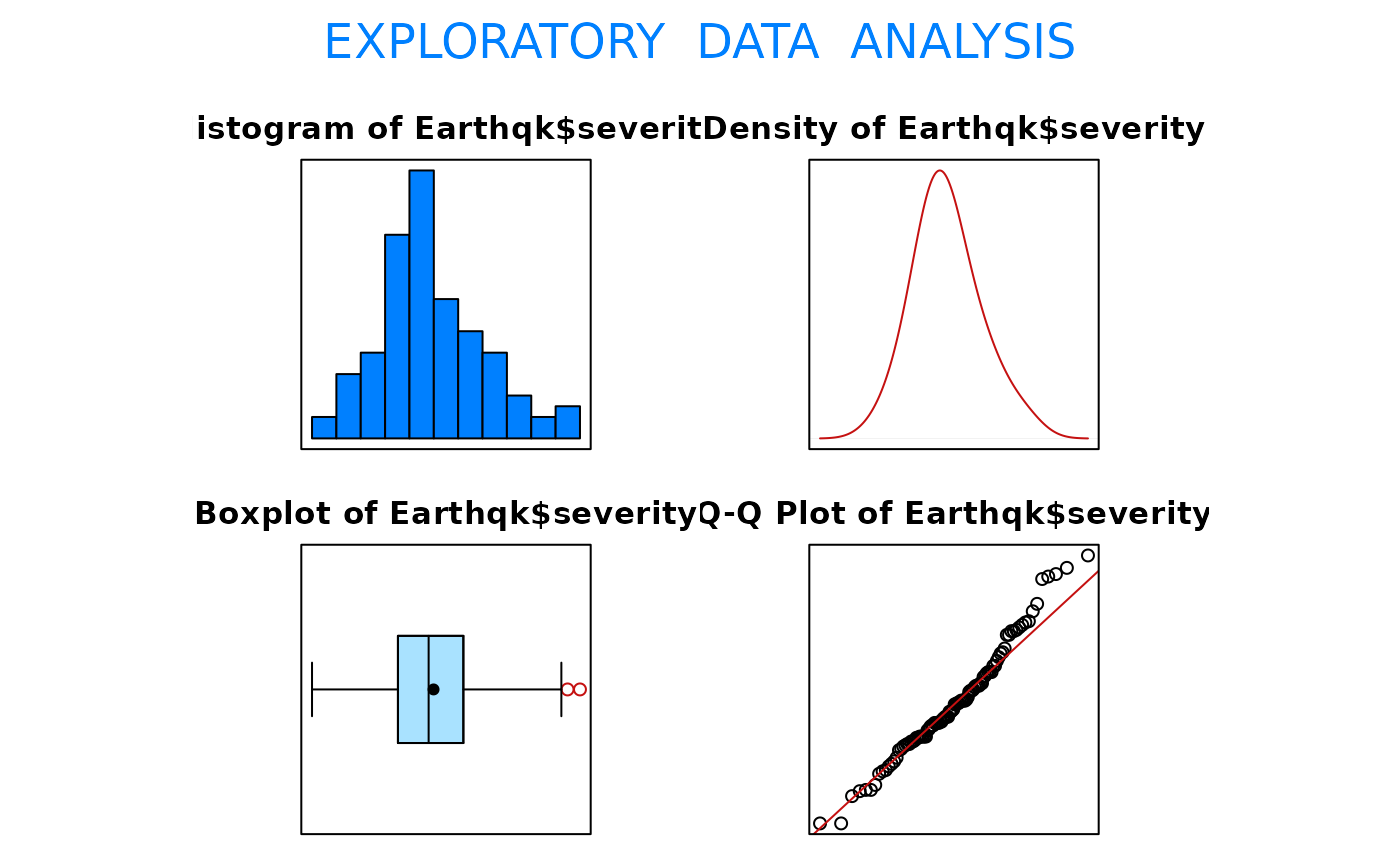 #> Size (n) Missing Minimum 1st Qu Mean Median TrMean 3rd Qu
#> 100.000 0.000 0.000 69.250 97.970 94.000 96.700 122.000
#> Max. Stdev. Var. SE Mean I.Q.R. Range Kurtosis Skewness
#> 216.000 44.704 1998.413 4.470 52.750 216.000 0.067 0.431
#> SW p-val
#> 0.082
t.test(Earthqk$severity, mu = 100, alternative = "greater")
#>
#> One Sample t-test
#>
#> data: Earthqk$severity
#> t = -0.4541, df = 99, p-value = 0.6746
#> alternative hypothesis: true mean is greater than 100
#> 95 percent confidence interval:
#> 90.54745 Inf
#> sample estimates:
#> mean of x
#> 97.97
#>
#> Size (n) Missing Minimum 1st Qu Mean Median TrMean 3rd Qu
#> 100.000 0.000 0.000 69.250 97.970 94.000 96.700 122.000
#> Max. Stdev. Var. SE Mean I.Q.R. Range Kurtosis Skewness
#> 216.000 44.704 1998.413 4.470 52.750 216.000 0.067 0.431
#> SW p-val
#> 0.082
t.test(Earthqk$severity, mu = 100, alternative = "greater")
#>
#> One Sample t-test
#>
#> data: Earthqk$severity
#> t = -0.4541, df = 99, p-value = 0.6746
#> alternative hypothesis: true mean is greater than 100
#> 95 percent confidence interval:
#> 90.54745 Inf
#> sample estimates:
#> mean of x
#> 97.97
#>