Data for Exercises 1.14 and 1.37
DiplomatFormat
A data frame/tibble with 10 observations on three variables
- country
a factor with levels
Brazil,Bulgaria,Egypt,Indonesia,Israel,Nigeria,Russia,S. Korea,Ukraine, andVenezuela- number
total number of tickets
- rate
number of tickets per vehicle per month
Source
Time, November 8, 1993. Figures are from January to June 1993.
References
Kitchens, L. J. (2003) Basic Statistics and Data Analysis. Pacific Grove, CA: Brooks/Cole, a division of Thomson Learning.
Examples
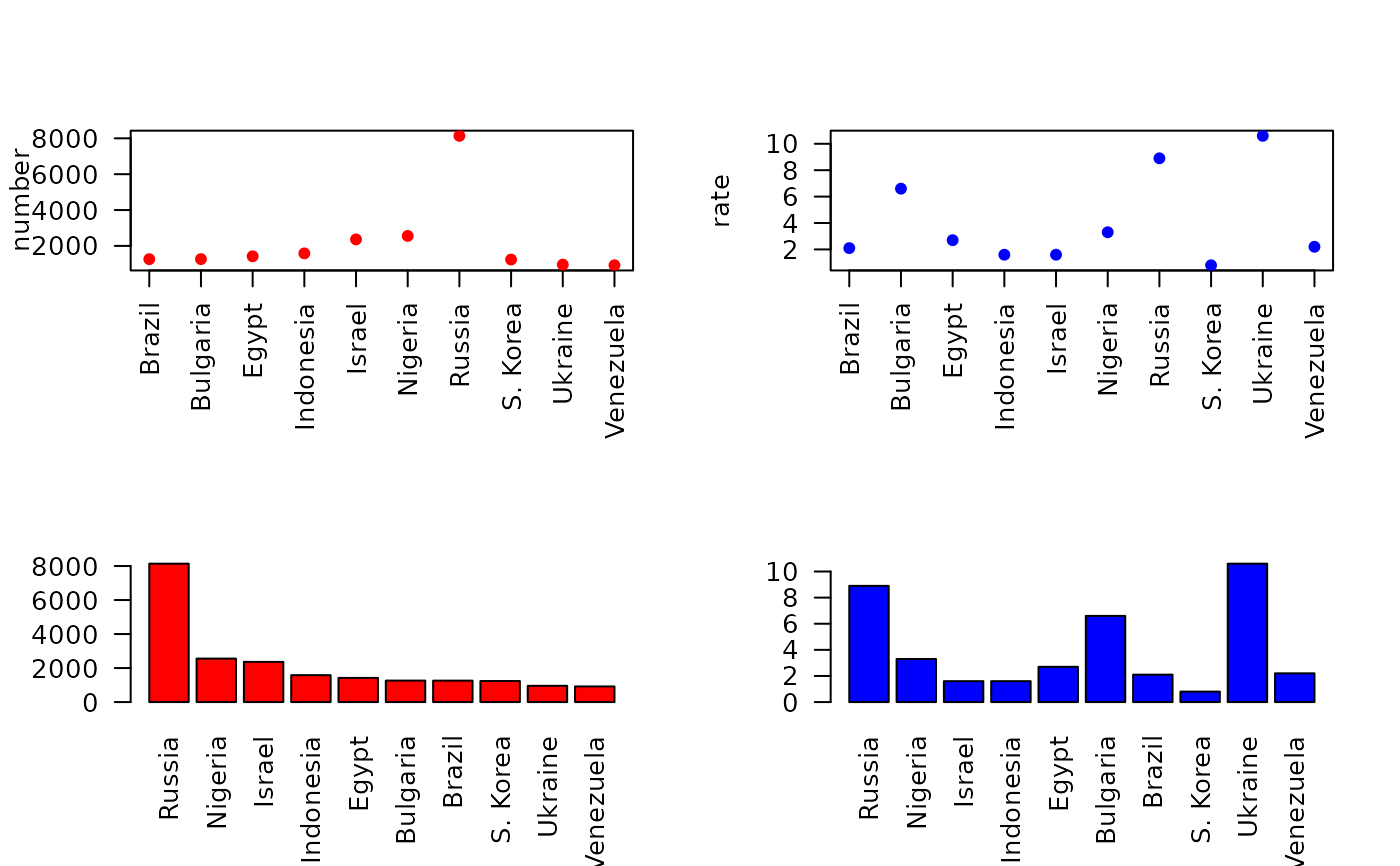
par(las = 2, mfrow = c(2, 2))
stripchart(number ~ country, data = Diplomat, pch = 19,
           col= "red", vertical = TRUE)
stripchart(rate ~ country, data = Diplomat, pch = 19,
           col= "blue", vertical = TRUE)
with(data = Diplomat,
     barplot(number, names.arg = country, col = "red"))
with(data = Diplomat,
     barplot(rate, names.arg = country, col = "blue"))

par(las = 1, mfrow = c(1, 1))
if (FALSE) {
library(ggplot2)
ggplot2::ggplot(data = Diplomat, aes(x = reorder(country, number),
                 y = number)) +
           geom_bar(stat = "identity", fill = "pink", color = "black") +
           theme_bw() + labs(x = "", y = "Total Number of Tickets")
ggplot2::ggplot(data = Diplomat, aes(x = reorder(country, rate),
                 y = rate)) +
           geom_bar(stat = "identity", fill = "pink", color = "black") +
           theme_bw() + labs(x = "", y = "Tickets per vehicle per month")
}
par(las = 1, mfrow = c(1, 1))
if (FALSE) {
library(ggplot2)
ggplot2::ggplot(data = Diplomat, aes(x = reorder(country, number),
y = number)) +
geom_bar(stat = "identity", fill = "pink", color = "black") +
theme_bw() + labs(x = "", y = "Total Number of Tickets")
ggplot2::ggplot(data = Diplomat, aes(x = reorder(country, rate),
y = rate)) +
geom_bar(stat = "identity", fill = "pink", color = "black") +
theme_bw() + labs(x = "", y = "Tickets per vehicle per month")
}