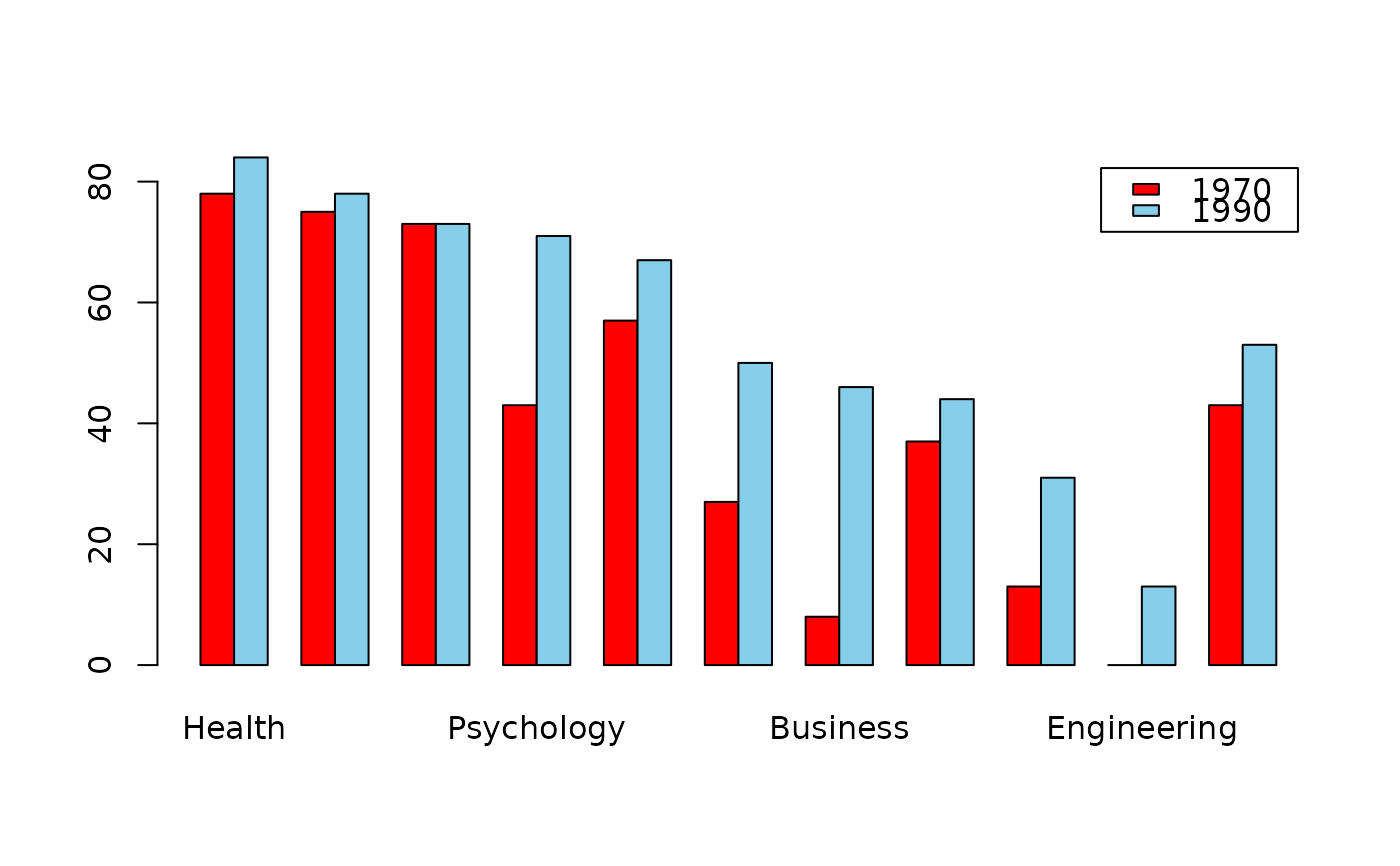
Data for Exercise 2.75
DegreeFormat
A data frame/tibble with 1064 observations on two variables
- field
a factor with levels
Health,Education,Foreign Language,Psychology,Fine Arts,Life Sciences,Business,Social Science,Physical Sciences,Engineering, andAll Fields- awarded
a factor with levels
1970and1990
Source
U.S. Department of Health and Human Services, National Center for Education Statistics.
References
Kitchens, L. J. (2003) Basic Statistics and Data Analysis. Pacific Grove, CA: Brooks/Cole, a division of Thomson Learning.
Examples
T1 <- xtabs(~field + awarded, data = Degree)
T1
#>                    awarded
#> field               1970 1990
#>   Health              78   84
#>   Education           75   78
#>   Foreign Language    73   73
#>   Psychology          43   71
#>   Fine Arts           57   67
#>   Life Sciences       27   50
#>   Business             8   46
#>   Social Science      37   44
#>   Physical Sciences   13   31
#>   Engineering          0   13
#>   All Fields          43   53
barplot(t(T1), beside = TRUE, col = c("red", "skyblue"), legend = colnames(T1))

rm(T1)