Data for Exercise 1.27
DefectivFormat
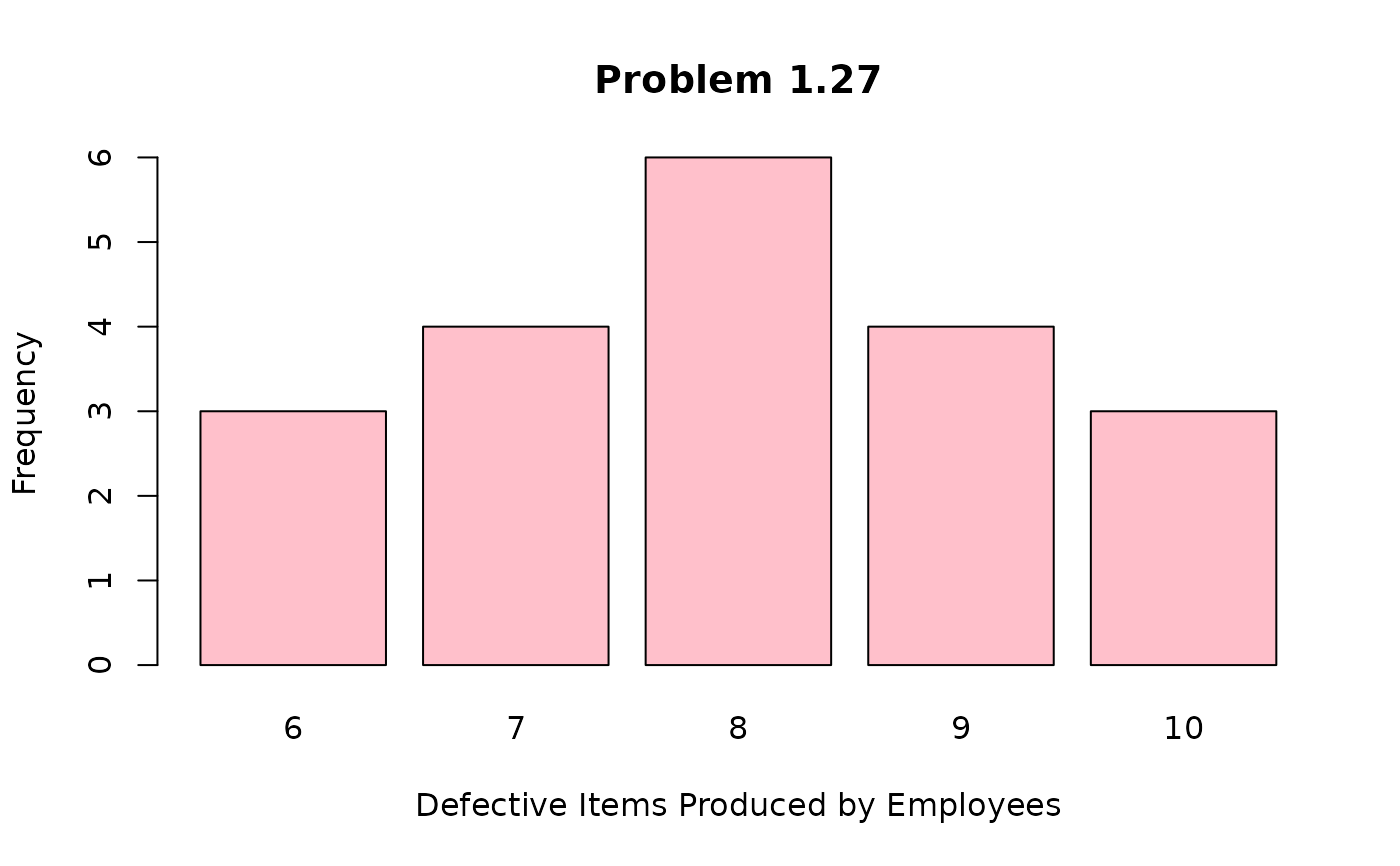
A data frame/tibble with 20 observations on one variable
- number
number of defective items produced by the employees in a small business firm
References
Kitchens, L. J. (2003) Basic Statistics and Data Analysis. Pacific Grove, CA: Brooks/Cole, a division of Thomson Learning.