Automobile dealers classified according to type dealership and service rendered to customers
Source:R/BSDA-package.R
Dealers.RdData for Example 2.22
DealersFormat
A data frame/tibble with 122 observations on two variables
- type
a factor with levels
Honda,Toyota,Mazda,Ford,Dodge, andSaturn- service
a factor with levels
Replaces unnecessarilyandFollows manufacturer guidelines
References
Kitchens, L. J. (2003) Basic Statistics and Data Analysis. Pacific Grove, CA: Brooks/Cole, a division of Thomson Learning.
Examples
xtabs(~type + service, data = Dealers)
#> service
#> type Replaces unnecessarily Follows manufacturer guidelines
#> Honda 19 2
#> Toyota 3 16
#> Mazda 12 9
#> Ford 8 13
#> Dodge 11 10
#> Saturn 4 15
T1 <- xtabs(~type + service, data = Dealers)
T1
#> service
#> type Replaces unnecessarily Follows manufacturer guidelines
#> Honda 19 2
#> Toyota 3 16
#> Mazda 12 9
#> Ford 8 13
#> Dodge 11 10
#> Saturn 4 15
addmargins(T1)
#> service
#> type Replaces unnecessarily Follows manufacturer guidelines Sum
#> Honda 19 2 21
#> Toyota 3 16 19
#> Mazda 12 9 21
#> Ford 8 13 21
#> Dodge 11 10 21
#> Saturn 4 15 19
#> Sum 57 65 122
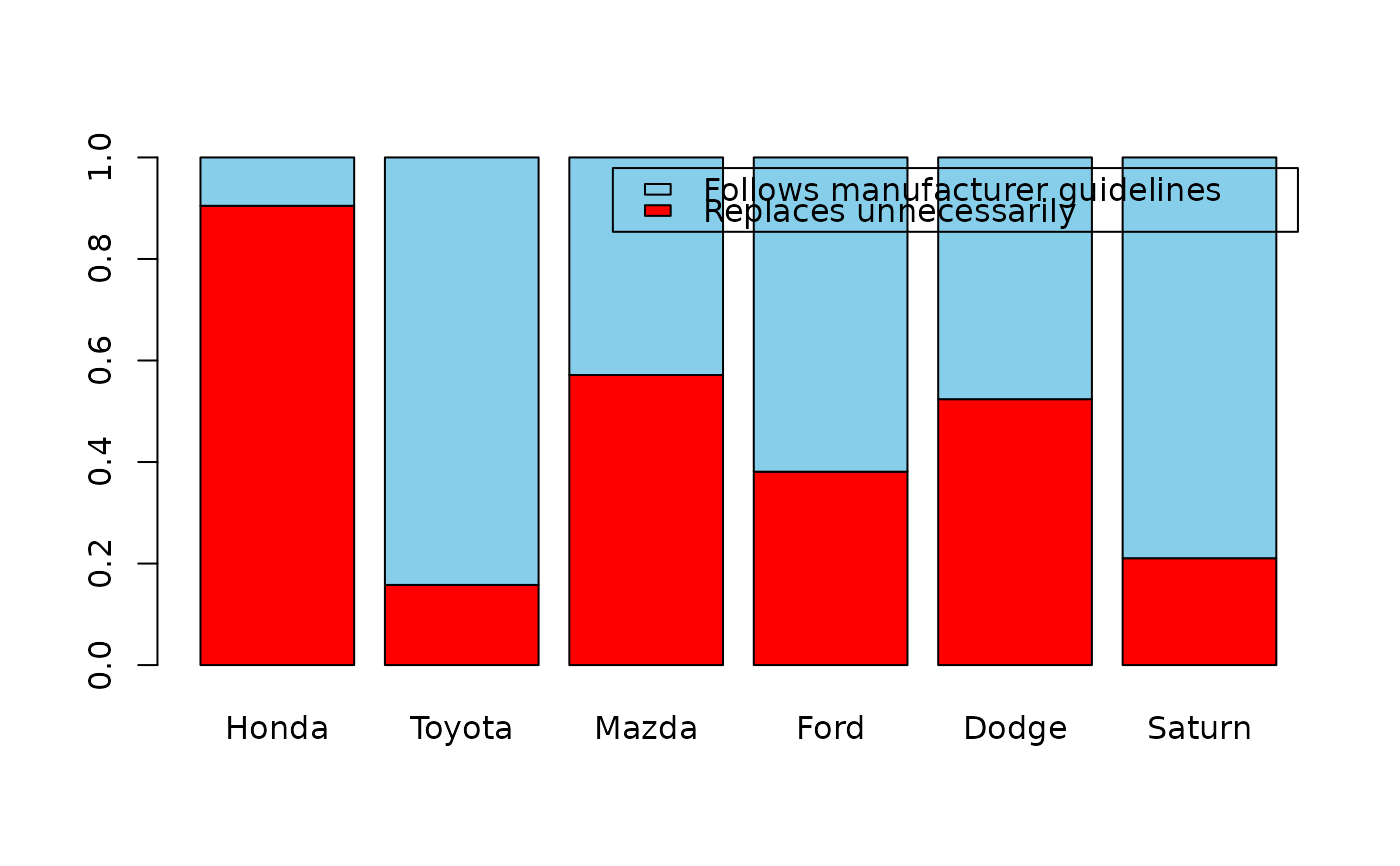
pt <- prop.table(T1, margin = 1)
pt
#> service
#> type Replaces unnecessarily Follows manufacturer guidelines
#> Honda 0.9047619 0.0952381
#> Toyota 0.1578947 0.8421053
#> Mazda 0.5714286 0.4285714
#> Ford 0.3809524 0.6190476
#> Dodge 0.5238095 0.4761905
#> Saturn 0.2105263 0.7894737
barplot(t(pt), col = c("red", "skyblue"), legend = colnames(T1))
 rm(T1, pt)