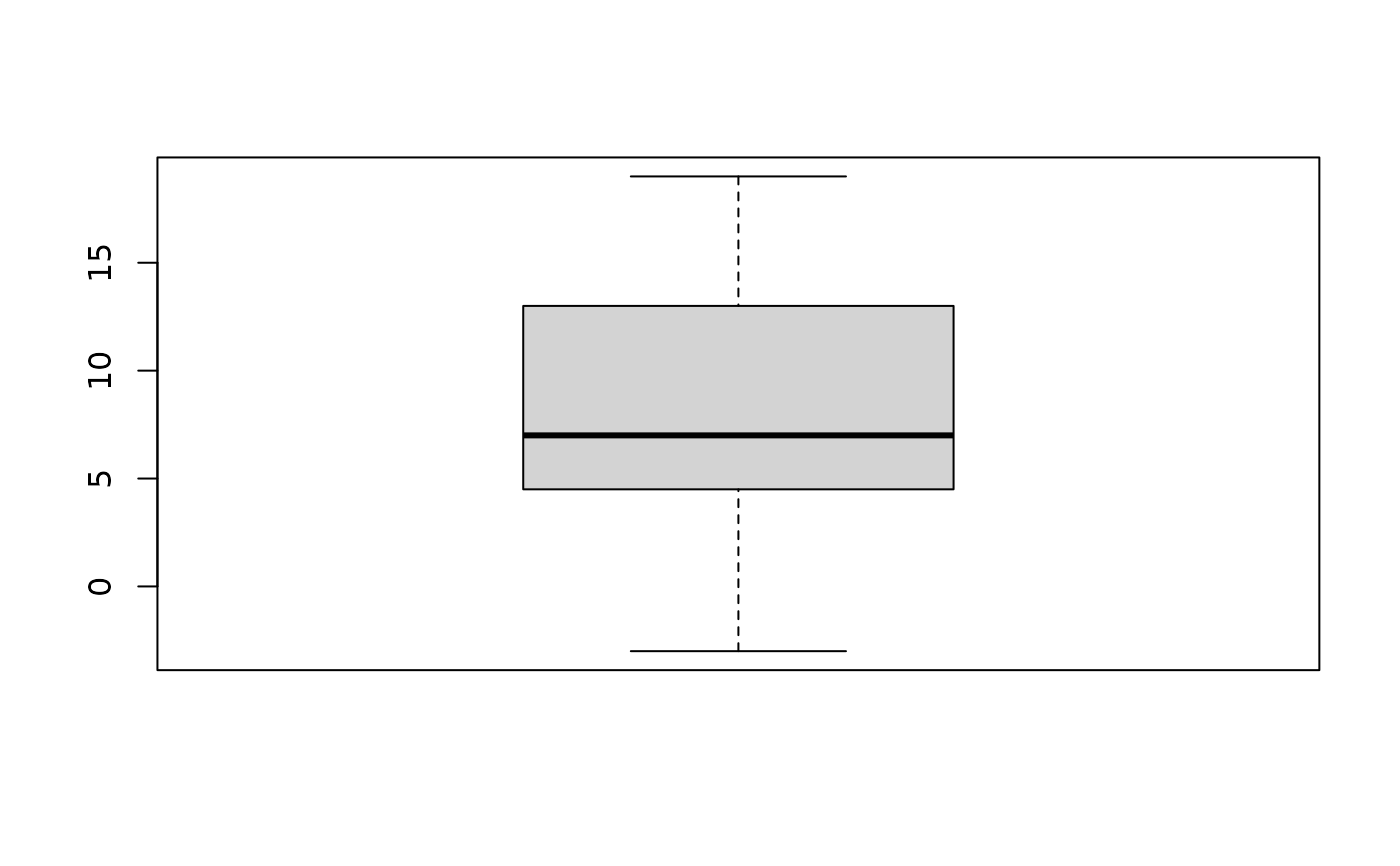
Comparison of the yields of a new variety and a standard variety of corn planted on 12 plots of land
Source:R/BSDA-package.R
Corn.RdData for Exercise 7.77
CornFormat
A data frame/tibble with 12 observations on three variables
- new
corn yield with new meathod
- standard
corn yield with standard method
- differences
newminusstandard
References
Kitchens, L. J. (2003) Basic Statistics and Data Analysis. Pacific Grove, CA: Brooks/Cole, a division of Thomson Learning.
Examples
boxplot(Corn$differences)

qqnorm(Corn$differences)
qqline(Corn$differences)

shapiro.test(Corn$differences)
#>
#> 	Shapiro-Wilk normality test
#>
#> data:  Corn$differences
#> W = 0.92248, p-value = 0.3072
#>
t.test(Corn$differences, alternative = "greater")
#>
#> 	One Sample t-test
#>
#> data:  Corn$differences
#> t = 3.8308, df = 11, p-value = 0.001395
#> alternative hypothesis: true mean is greater than 0
#> 95 percent confidence interval:
#>  4.116803      Inf
#> sample estimates:
#> mean of x
#>      7.75
#>