Data for Exercises 1.13, and 7.85
CommuteFormat
A data frame/tibble with 39 observations on three variables
- city
a factor with levels
Atlanta,Baltimore,Boston,Buffalo,Charlotte,Chicago,Cincinnati,Cleveland,Columbus,Dallas,Denver,Detroit,Hartford,Houston,Indianapolis,Kansas City,Los Angeles,Miami,Milwaukee,Minneapolis,New Orleans,New York,Norfolk,Orlando,Philadelphia,Phoenix,Pittsburgh,Portland,Providence,Rochester,Sacramento,Salt Lake City,San Antonio,San Diego,San Francisco,Seattle,St. Louis,Tampa, andWashington- year
year
- time
commute times
Source
Federal Highway Administration.
References
Kitchens, L. J. (2003) Basic Statistics and Data Analysis. Pacific Grove, CA: Brooks/Cole, a division of Thomson Learning.
Examples
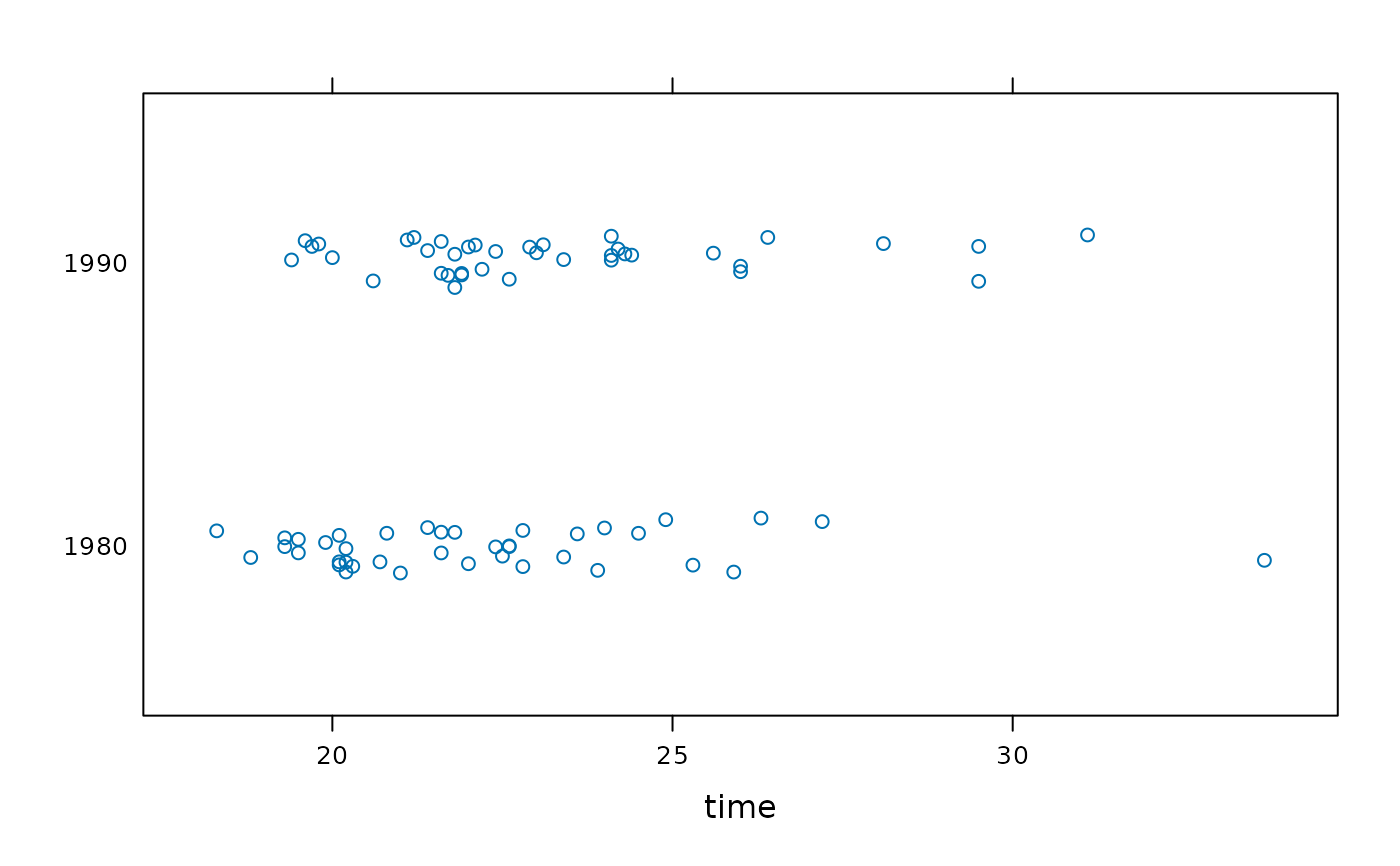
stripplot(year ~ time, data = Commute, jitter = TRUE)
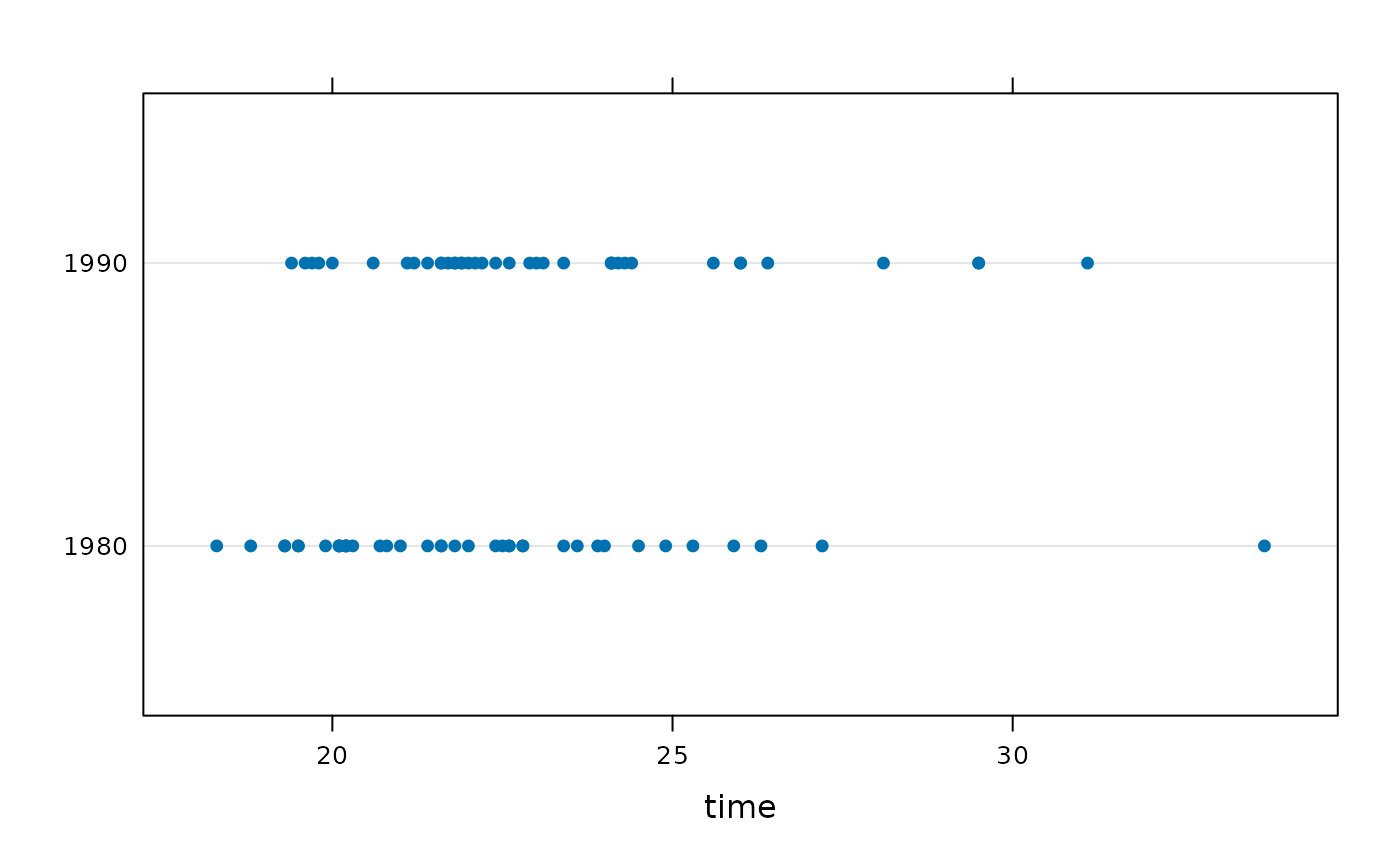
 dotplot(year ~ time, data = Commute)
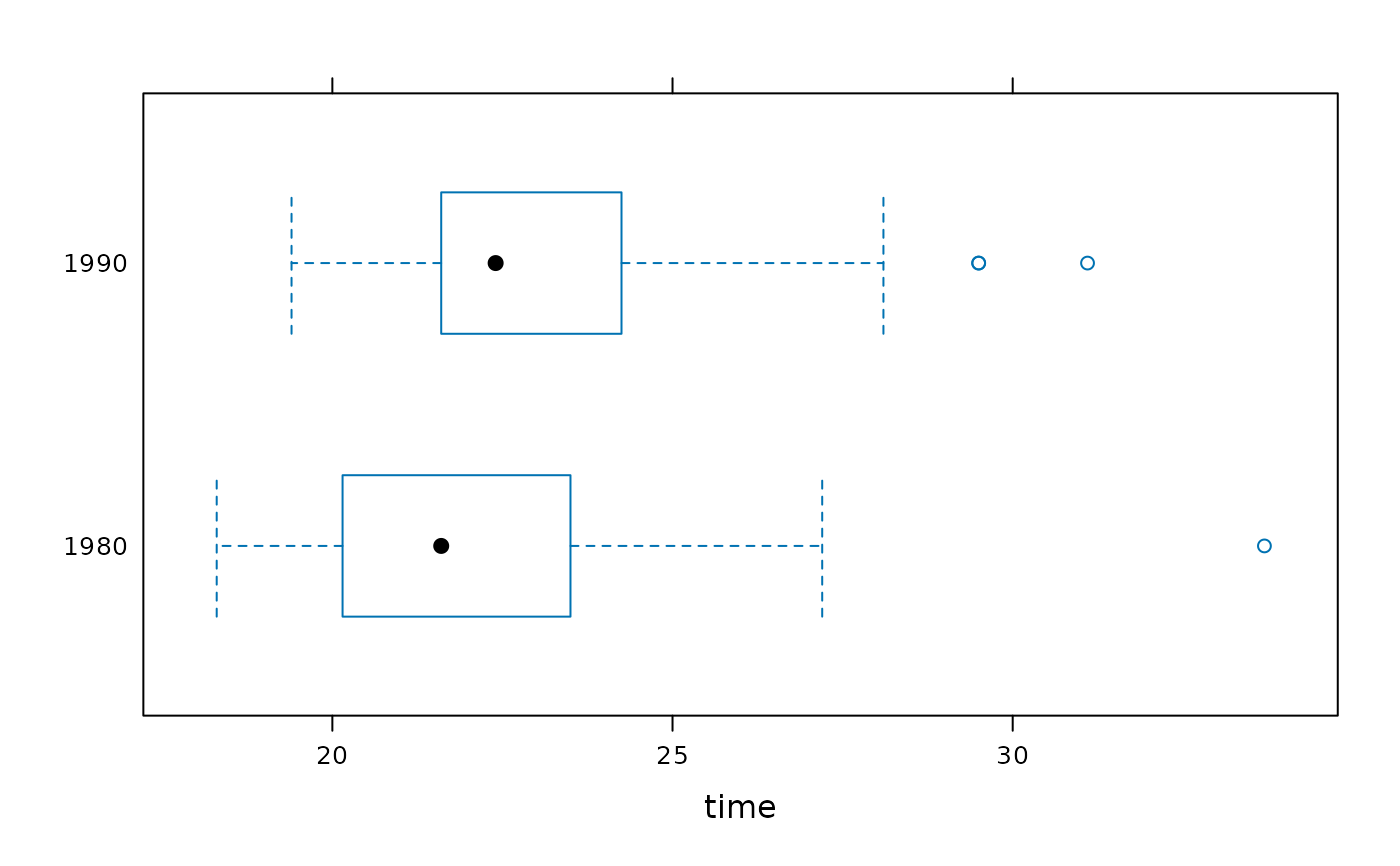
 bwplot(year ~ time, data = Commute)
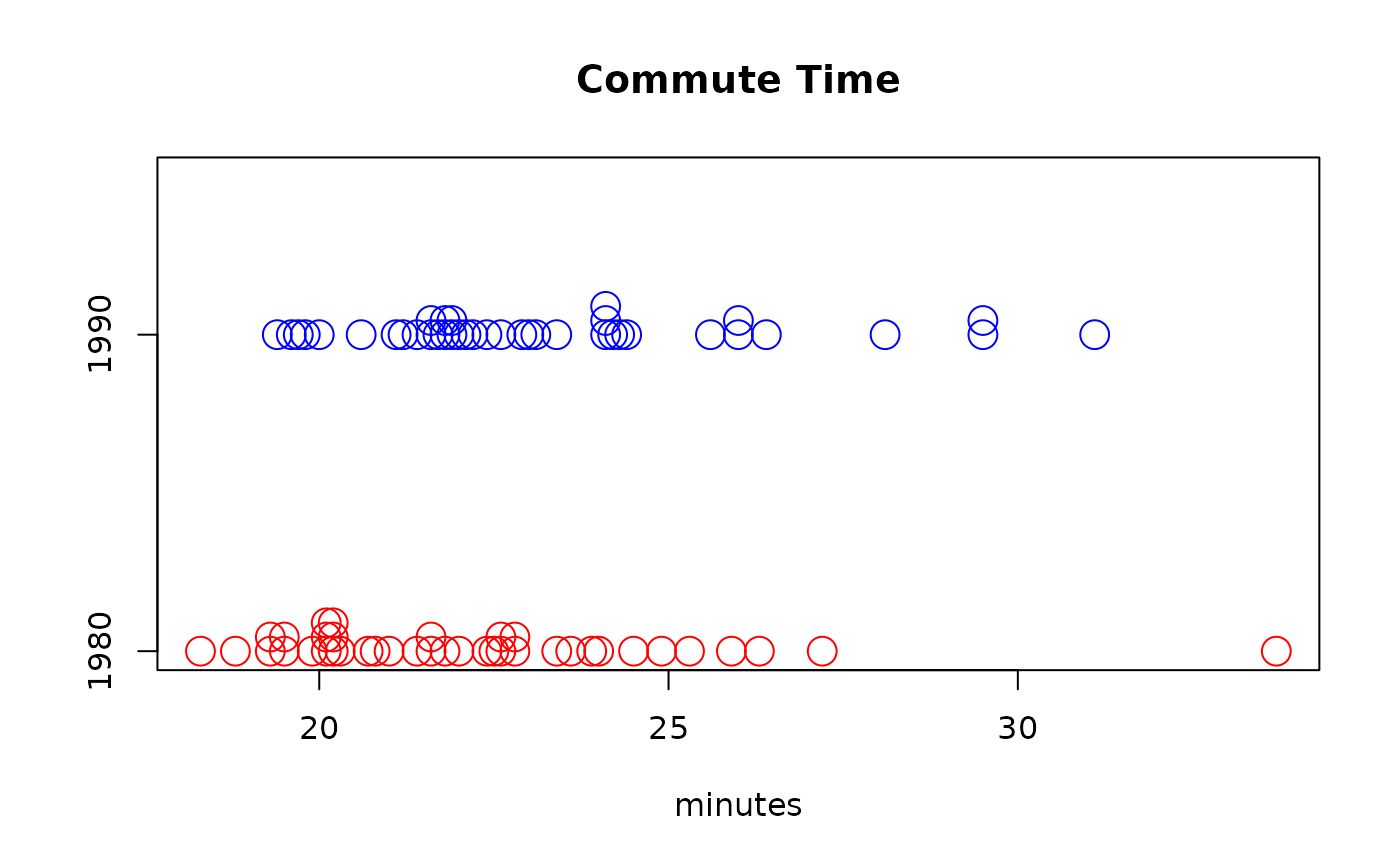
 stripchart(time ~ year, data = Commute, method = "stack", pch = 1,
cex = 2, col = c("red", "blue"),
group.names = c("1980", "1990"),
main = "", xlab = "minutes")
title(main = "Commute Time")
stripchart(time ~ year, data = Commute, method = "stack", pch = 1,
cex = 2, col = c("red", "blue"),
group.names = c("1980", "1990"),
main = "", xlab = "minutes")
title(main = "Commute Time")
 boxplot(time ~ year, data = Commute, names=c("1980", "1990"),
horizontal = TRUE, las = 1)
boxplot(time ~ year, data = Commute, names=c("1980", "1990"),
horizontal = TRUE, las = 1)