Data for Exercise 10.24 and 10.25
CoaxialFormat
A data frame/tibble with 45 observations on two variables
- signal
signal loss per 1000 feet
- cable
factor with three levels of coaxial cable
typeA,typeB, andtypeC
References
Kitchens, L. J. (2003) Basic Statistics and Data Analysis. Pacific Grove, CA: Brooks/Cole, a division of Thomson Learning.
Examples
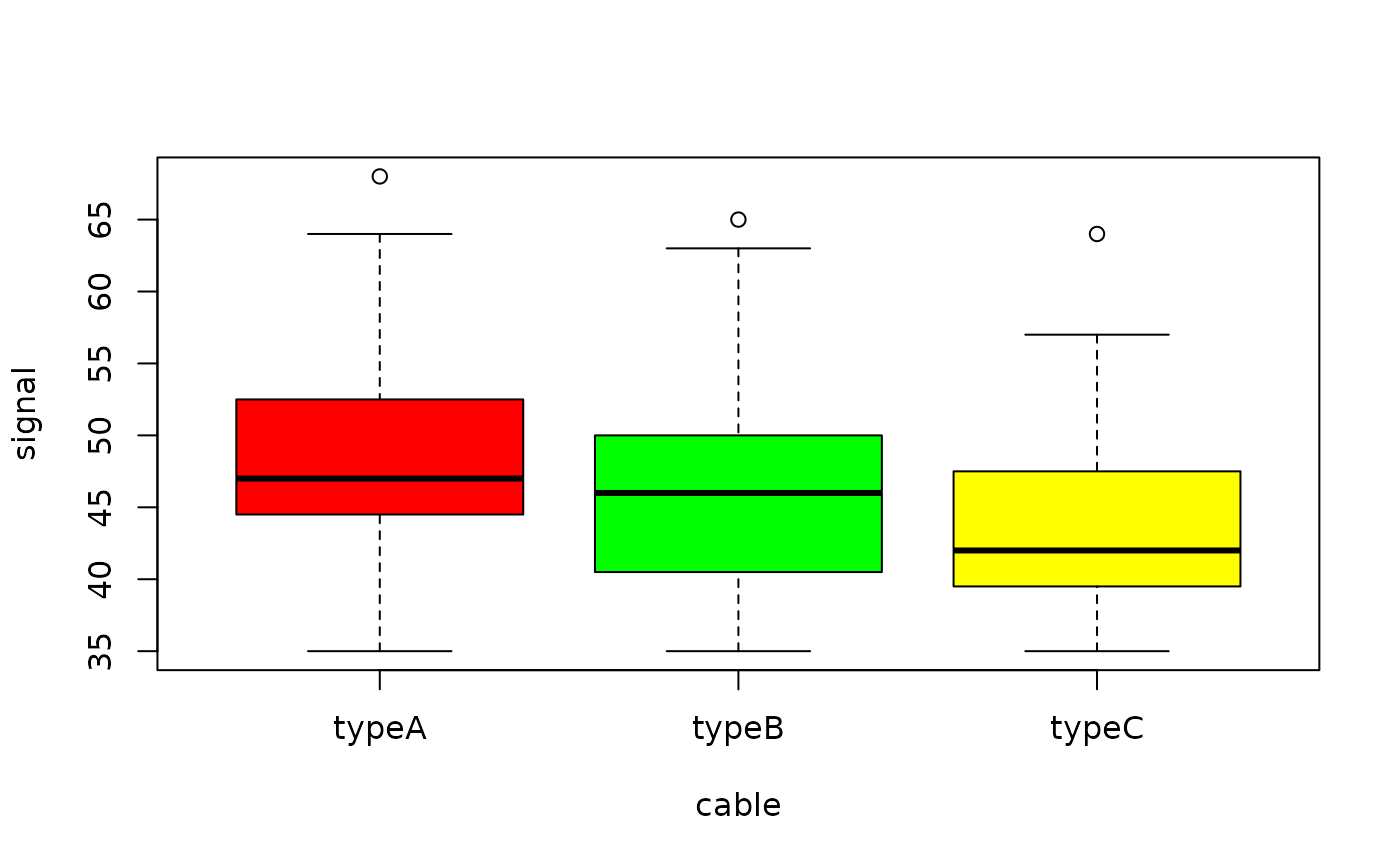
boxplot(signal ~ cable, data = Coaxial, col = c("red", "green", "yellow"))

kruskal.test(signal ~ cable, data = Coaxial)
#>
#> 	Kruskal-Wallis rank sum test
#>
#> data:  signal by cable
#> Kruskal-Wallis chi-squared = 3.138, df = 2, p-value = 0.2083
#>
kruskal.test(signal ~ cable, data = Coaxial)
#>
#> Kruskal-Wallis rank sum test
#>
#> data: signal by cable
#> Kruskal-Wallis chi-squared = 3.138, df = 2, p-value = 0.2083
#>