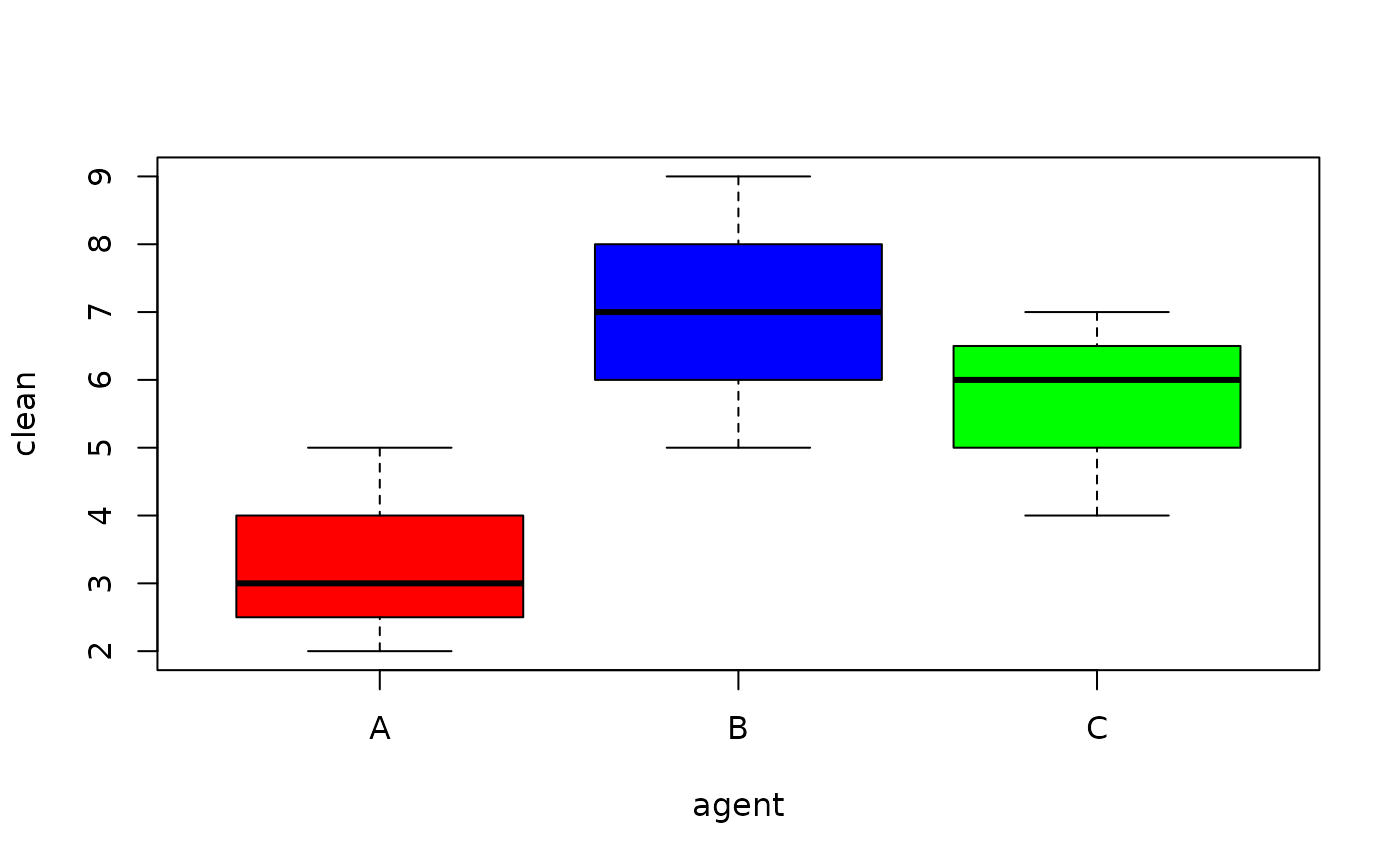
Residual contaminant following the use of three different cleansing agents
Source:R/BSDA-package.R
Clean.RdData for Exercise 10.16
CleanFormat
A data frame/tibble with 45 observations on two variables
- clean
residual contaminants
- agent
a factor with levels
A,B, andC
References
Kitchens, L. J. (2003) Basic Statistics and Data Analysis. Pacific Grove, CA: Brooks/Cole, a division of Thomson Learning.
Examples
boxplot(clean ~ agent, col = c("red", "blue", "green"), data = Clean)

anova(lm(clean ~ agent, data = Clean))
#> Analysis of Variance Table
#>
#> Response: clean
#>           Df  Sum Sq Mean Sq F value    Pr(>F)
#> agent      2 108.133  54.067   47.44 1.679e-11 ***
#> Residuals 42  47.867   1.140
#> ---
#> Signif. codes:  0 ‘***’ 0.001 ‘**’ 0.01 ‘*’ 0.05 ‘.’ 0.1 ‘ ’ 1
anova(lm(clean ~ agent, data = Clean))
#> Analysis of Variance Table
#>
#> Response: clean
#> Df Sum Sq Mean Sq F value Pr(>F)
#> agent 2 108.133 54.067 47.44 1.679e-11 ***
#> Residuals 42 47.867 1.140
#> ---
#> Signif. codes: 0 ‘***’ 0.001 ‘**’ 0.01 ‘*’ 0.05 ‘.’ 0.1 ‘ ’ 1