Data for Exercise 10.15
ChickenFormat
A data frame/tibble with 13 observations onthree variables
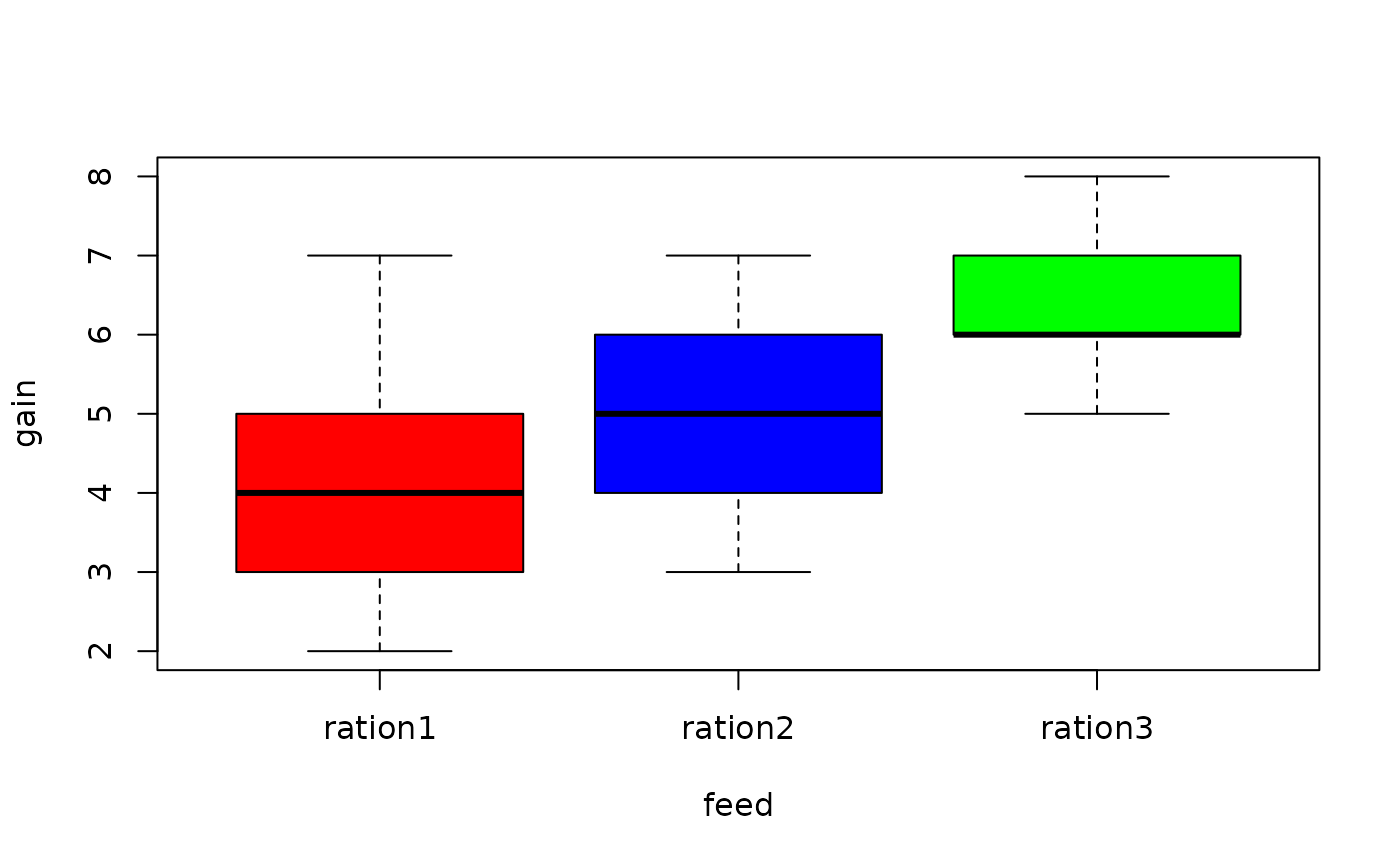
- gain
weight gain over a specified period
- feed
a factor with levels
ration1,ration2, andration3
References
Kitchens, L. J. (2003) Basic Statistics and Data Analysis. Pacific Grove, CA: Brooks/Cole, a division of Thomson Learning.
Examples
boxplot(gain ~ feed, col = c("red","blue","green"), data = Chicken)

anova(lm(gain ~ feed, data = Chicken))
#> Analysis of Variance Table
#>
#> Response: gain
#>           Df Sum Sq Mean Sq F value    Pr(>F)
#> feed       2 32.974 16.4872   12.17 9.172e-05 ***
#> Residuals 36 48.769  1.3547
#> ---
#> Signif. codes:  0 ‘***’ 0.001 ‘**’ 0.01 ‘*’ 0.05 ‘.’ 0.1 ‘ ’ 1
anova(lm(gain ~ feed, data = Chicken))
#> Analysis of Variance Table
#>
#> Response: gain
#> Df Sum Sq Mean Sq F value Pr(>F)
#> feed 2 32.974 16.4872 12.17 9.172e-05 ***
#> Residuals 36 48.769 1.3547
#> ---
#> Signif. codes: 0 ‘***’ 0.001 ‘**’ 0.01 ‘*’ 0.05 ‘.’ 0.1 ‘ ’ 1