Survival times of terminal cancer patients treated with vitamin C
Source:R/BSDA-package.R
Cancer.RdData for Exercises 6.55 and 6.64
CancerFormat
A data frame/tibble with 64 observations on two variables
- survival
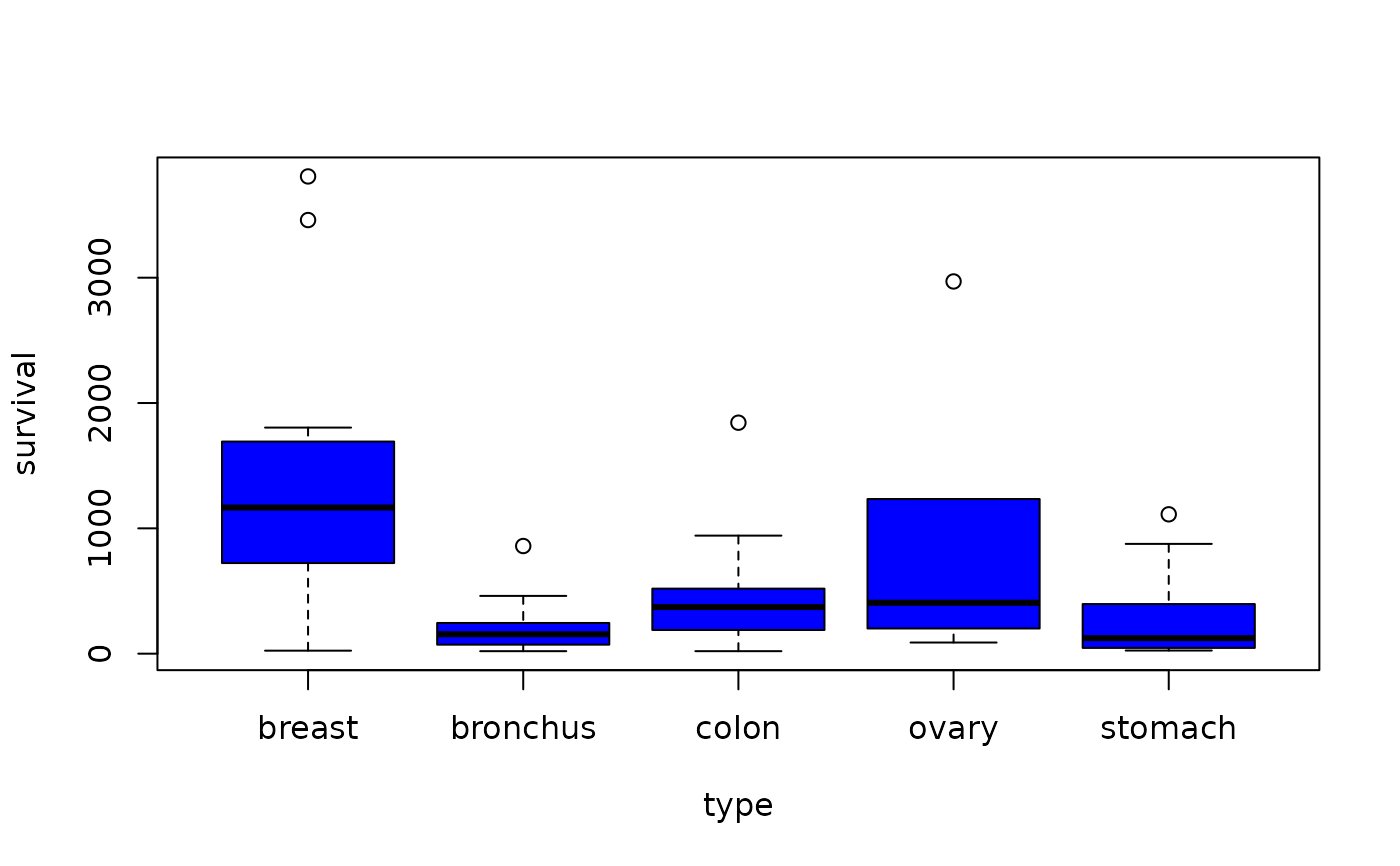
survival time (in days) of terminal patients treated with vitamin C
- type
a factor indicating type of cancer with levels
breast,bronchus,colon,ovary, andstomach
Source
Cameron, E and Pauling, L. 1978. “Supplemental Ascorbate in the Supportive Treatment of Cancer.” Proceedings of the National Academy of Science, 75, 4538-4542.
References
Kitchens, L. J. (2003) Basic Statistics and Data Analysis. Pacific Grove, CA: Brooks/Cole, a division of Thomson Learning.
Examples
boxplot(survival ~ type, Cancer, col = "blue")

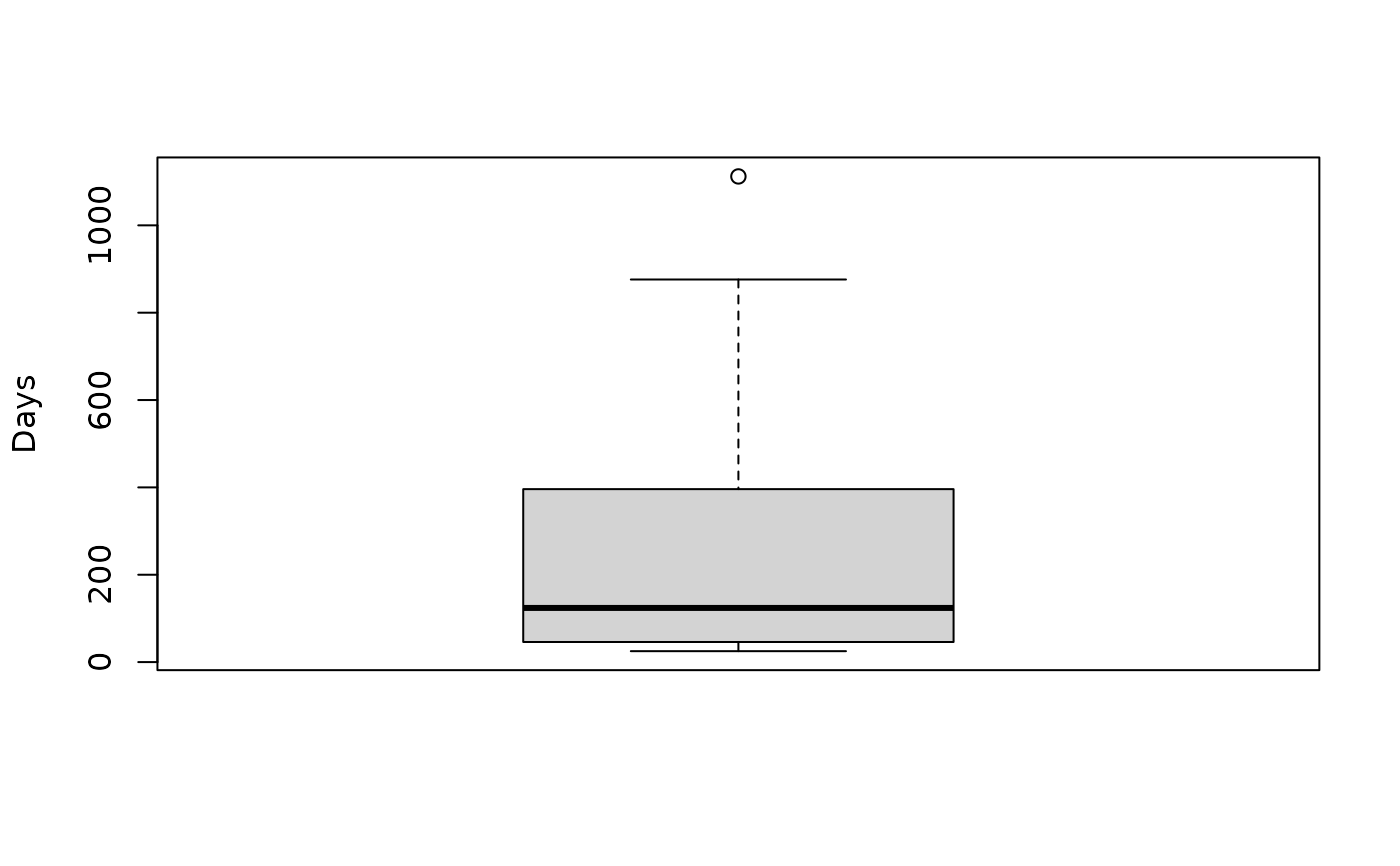
stomach <- Cancer$survival[Cancer$type == "stomach"]
bronchus <- Cancer$survival[Cancer$type == "bronchus"]
boxplot(stomach, ylab = "Days")

SIGN.test(stomach, md = 100, alternative = "greater")
#>
#> 	One-sample Sign-Test
#>
#> data:  stomach
#> s = 8, p-value = 0.2905
#> alternative hypothesis: true median is greater than 100
#> 95 percent confidence interval:
#>  46.22098      Inf
#> sample estimates:
#> median of x
#>         124
#>
#> Achieved and Interpolated Confidence Intervals:
#>
#>                   Conf.Level L.E.pt U.E.pt
#> Lower Achieved CI     0.8666 51.000    Inf
#> Interpolated CI       0.9500 46.221    Inf
#> Upper Achieved CI     0.9539 46.000    Inf
#>
SIGN.test(bronchus, md = 100, alternative = "greater")
#>
#> 	One-sample Sign-Test
#>
#> data:  bronchus
#> s = 11, p-value = 0.1662
#> alternative hypothesis: true median is greater than 100
#> 95 percent confidence interval:
#>  76.85721      Inf
#> sample estimates:
#> median of x
#>         155
#>
#> Achieved and Interpolated Confidence Intervals:
#>
#>                   Conf.Level  L.E.pt U.E.pt
#> Lower Achieved CI     0.9283 81.0000    Inf
#> Interpolated CI       0.9500 76.8572    Inf
#> Upper Achieved CI     0.9755 72.0000    Inf
#>
rm(bronchus, stomach)