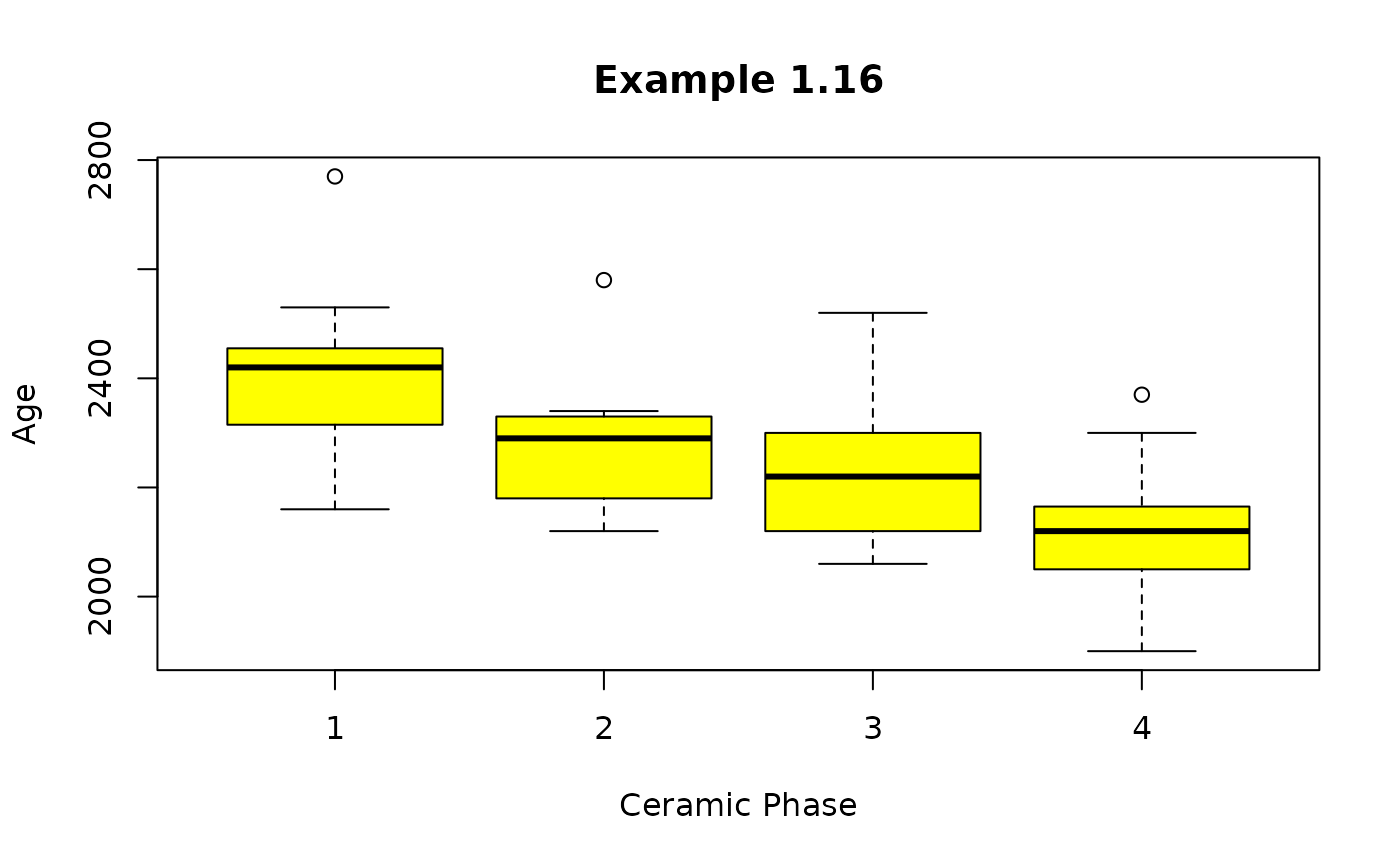
Radiocarbon ages of observations taken from an archaeological site
Source:R/BSDA-package.R
Archaeo.RdData for Exercises 5.120, 10.20 and Example 1.16
ArchaeoFormat
A data frame/tibble with 60 observations on two variables
- age
number of years before 1983 - the year the data were obtained
- phase
Ceramic Phase numbers
Source
Cunliffe, B. (1984) and Naylor and Smith (1988).
References
Kitchens, L. J. (2003) Basic Statistics and Data Analysis. Pacific Grove, CA: Brooks/Cole, a division of Thomson Learning.
Examples
boxplot(age ~ phase, data = Archaeo, col = "yellow",
        main = "Example 1.16", xlab = "Ceramic Phase", ylab = "Age")

anova(lm(age ~ as.factor(phase), data= Archaeo))
#> Analysis of Variance Table
#>
#> Response: age
#>                  Df Sum Sq Mean Sq F value    Pr(>F)
#> as.factor(phase)  3 661865  220622  13.005 1.479e-06 ***
#> Residuals        56 950028   16965
#> ---
#> Signif. codes:  0 ‘***’ 0.001 ‘**’ 0.01 ‘*’ 0.05 ‘.’ 0.1 ‘ ’ 1
anova(lm(age ~ as.factor(phase), data= Archaeo))
#> Analysis of Variance Table
#>
#> Response: age
#> Df Sum Sq Mean Sq F value Pr(>F)
#> as.factor(phase) 3 661865 220622 13.005 1.479e-06 ***
#> Residuals 56 950028 16965
#> ---
#> Signif. codes: 0 ‘***’ 0.001 ‘**’ 0.01 ‘*’ 0.05 ‘.’ 0.1 ‘ ’ 1