Incubation times for 295 patients thought to be infected with HIV by a blood transfusion
Source:R/BSDA-package.R
Aids.RdData used in Exercise 6.60
AidsFormat
A data frame/tibble with 295 observations on three variables
- duration
time (in months) from HIV infection to the clinical manifestation of full-blown AIDS
- age
age (in years) of patient
- group
a numeric vector
Source
Kalbsleich, J. and Lawless, J., (1989), An analysis of the data on transfusion related AIDS, Journal of the American Statistical Association, 84, 360-372.
References
Kitchens, L. J. (2003) Basic Statistics and Data Analysis. Pacific Grove, CA: Brooks/Cole, a division of Thomson Learning.
Examples
with(data = Aids,
EDA(duration)
)
#> [1] "duration"
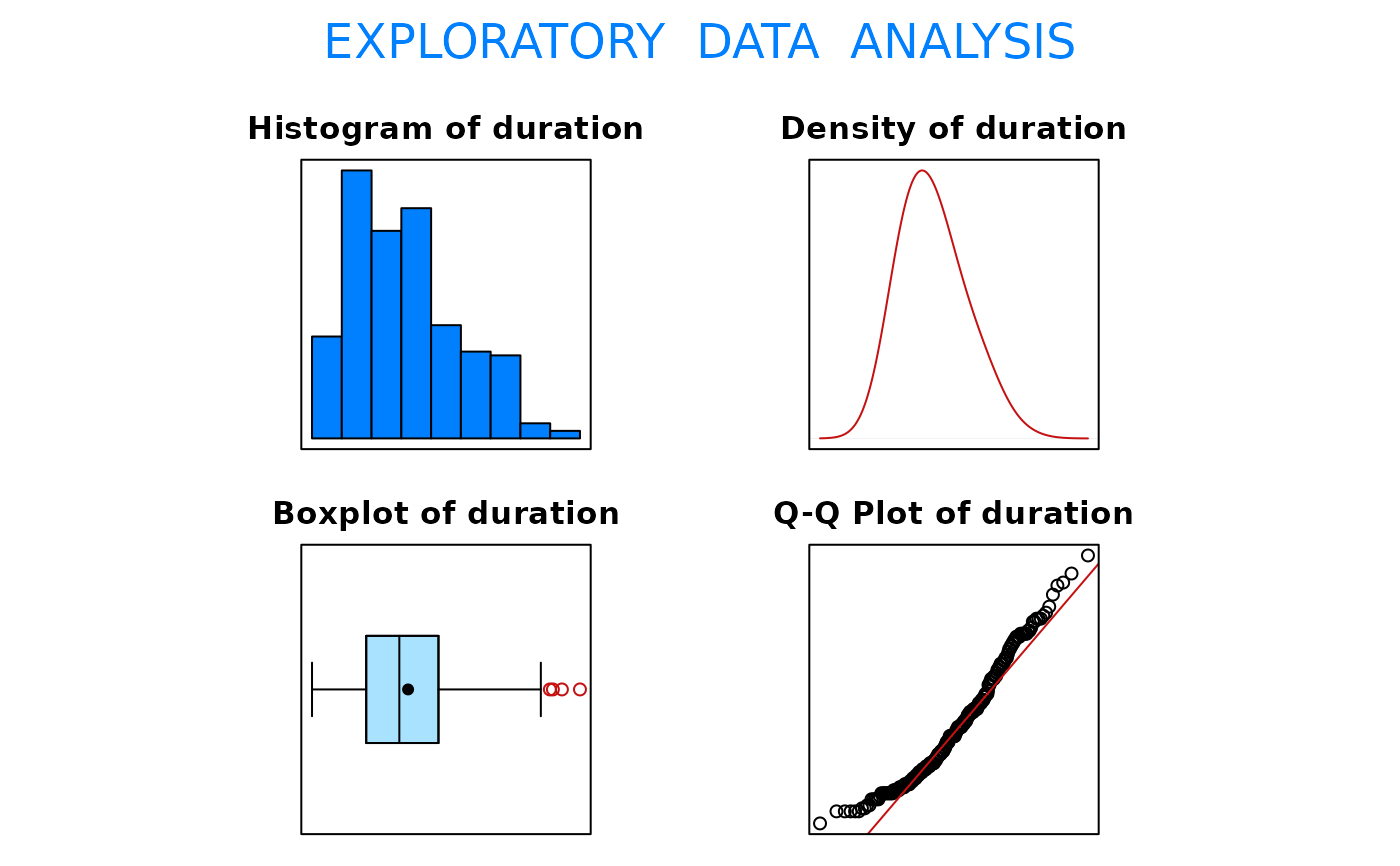 #> Size (n) Missing Minimum 1st Qu Mean Median TrMean 3rd Qu
#> 295.000 0.000 0.000 18.000 31.908 29.000 31.154 42.000
#> Max. Stdev. Var. SE Mean I.Q.R. Range Kurtosis Skewness
#> 89.000 17.943 321.968 1.045 24.000 89.000 -0.232 0.633
#> SW p-val
#> 0.000
with(data = Aids,
t.test(duration, mu = 30, alternative = "greater")
)
#>
#> One Sample t-test
#>
#> data: duration
#> t = 1.8268, df = 294, p-value = 0.03437
#> alternative hypothesis: true mean is greater than 30
#> 95 percent confidence interval:
#> 30.18465 Inf
#> sample estimates:
#> mean of x
#> 31.90847
#>
with(data = Aids,
SIGN.test(duration, md = 24, alternative = "greater")
)
#>
#> One-sample Sign-Test
#>
#> data: duration
#> s = 174, p-value = 0.0002434
#> alternative hypothesis: true median is greater than 24
#> 95 percent confidence interval:
#> 27 Inf
#> sample estimates:
#> median of x
#> 29
#>
#> Achieved and Interpolated Confidence Intervals:
#>
#> Conf.Level L.E.pt U.E.pt
#> Lower Achieved CI 0.9486 27 Inf
#> Interpolated CI 0.9500 27 Inf
#> Upper Achieved CI 0.9597 27 Inf
#>
#> Size (n) Missing Minimum 1st Qu Mean Median TrMean 3rd Qu
#> 295.000 0.000 0.000 18.000 31.908 29.000 31.154 42.000
#> Max. Stdev. Var. SE Mean I.Q.R. Range Kurtosis Skewness
#> 89.000 17.943 321.968 1.045 24.000 89.000 -0.232 0.633
#> SW p-val
#> 0.000
with(data = Aids,
t.test(duration, mu = 30, alternative = "greater")
)
#>
#> One Sample t-test
#>
#> data: duration
#> t = 1.8268, df = 294, p-value = 0.03437
#> alternative hypothesis: true mean is greater than 30
#> 95 percent confidence interval:
#> 30.18465 Inf
#> sample estimates:
#> mean of x
#> 31.90847
#>
with(data = Aids,
SIGN.test(duration, md = 24, alternative = "greater")
)
#>
#> One-sample Sign-Test
#>
#> data: duration
#> s = 174, p-value = 0.0002434
#> alternative hypothesis: true median is greater than 24
#> 95 percent confidence interval:
#> 27 Inf
#> sample estimates:
#> median of x
#> 29
#>
#> Achieved and Interpolated Confidence Intervals:
#>
#> Conf.Level L.E.pt U.E.pt
#> Lower Achieved CI 0.9486 27 Inf
#> Interpolated CI 0.9500 27 Inf
#> Upper Achieved CI 0.9597 27 Inf
#>